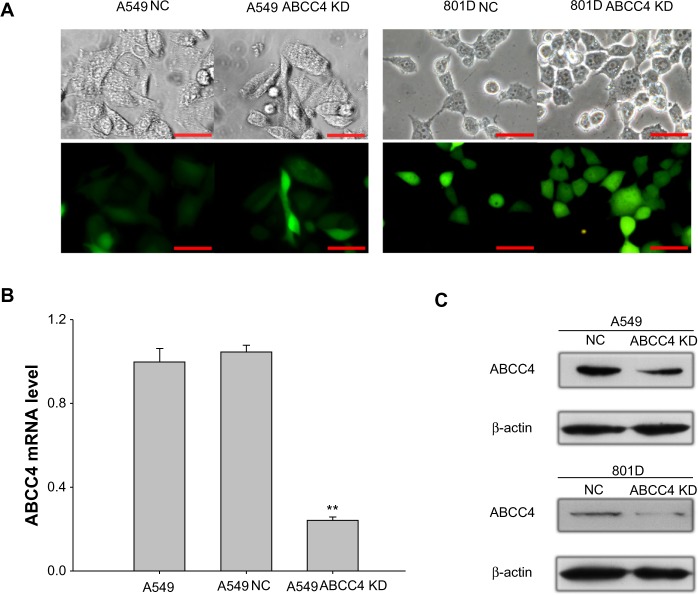
Figure 2.
Lentivirus-mediated ABCC4-shRNA knockdown of ABCC4 expression. (A) GFP fluorescence was detected using a fluorescence microscope 48 hours after infection. Fluorescence images are shown in the bottom panel, and the corresponding images in bright field are shown in the upper panel. Scale bar, 50 micrometer. (B) Real-time polymerase chain reaction assay was done to confirm the ABCC4 mRNA level in ABCC4 knockdown A549 cells. The y axis represents normalized ABCC4 mRNA expression relative to A549 cells. The relative mRNA level is presented as 2−ΔCT. The data are shown as the mean ± standard error of the mean of three separate experiments. **P<0.01 (versus A549, t-test). (C) Western blot analysis of ABCC4 levels. ABCC4 levels were determined by Western blot and β-actin levels were detected as the control. ABCC4 expression was weakened in A549 ABCC4 KD, and 801D ABCC4 KD cells. The experiments were repeated three times.

