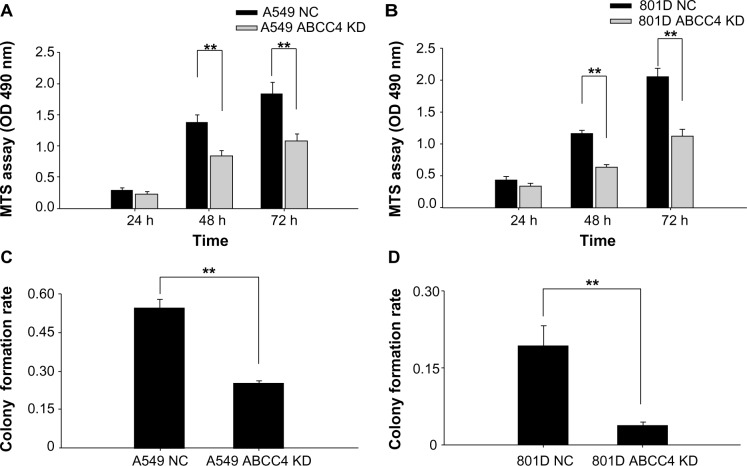
Figure 3.
Cell growth inhibition in ABCC4 mRNA knockdown (KD) A549 and 801D cells. (A and B) A549 ABCC4 KD cells, 801D ABCC4 KD cells, and control cells were seeded in 96-well plates and an MTS assay was performed. Absorbance at 490 nm (y axis) was measured at 24-hourly intervals to 72 hours. The data are expressed as the mean ± standard error of the mean from three separate experiments. **P<0.01 (t-test). (C and D) Colony formation efficiency in A549 ABCC4 KD, 801D ABCC4 KD, A549 NC, and 801D NC cells. The data are expressed as the mean ± standard error of the mean from three separate experiments. **P<0.01 (t-test).

