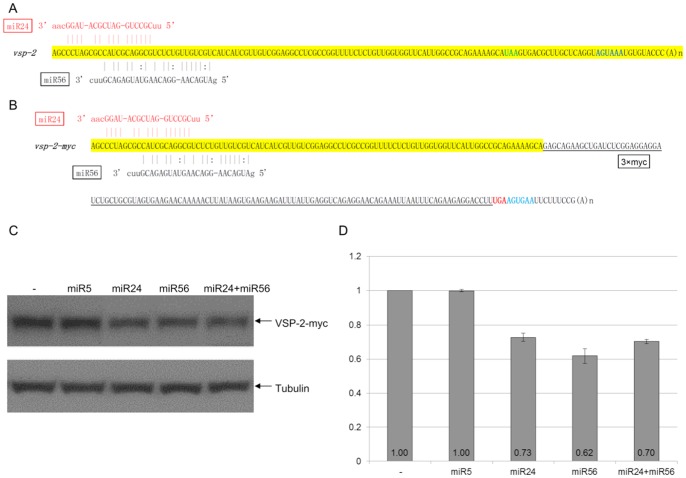
Figure 3. miRNA-mediated regulation of VSP-2 expression.
A) Schematic diagram of the vsp-2 mRNA 3′ region (100 nts upstream of the stop codon and 3′ UTR) with the binding sites for miR24 and miR56. miRNAs with fully complementary seed sequence binding sites are shown in red while miRNAs with G:U wobble pairs in the seed sequence are in black. The stop codon is shown in green and the polyadenylation signal is in blue. B) Schematic diagram of the vsp-2-myc mRNA detailing incorporation of the 3xmyc tag and elimination of the native 3′ UTR. Coloring is the same as in A). C) VSP-2-myc expression in Giardia cells transfected with the indicated miRNAs was analyzed with Western blot. Tubulin was used as a loading control. D) Densitometry analysis of three independent Western blot experiments is shown as a histograph with the error bars representing the standard deviation.

