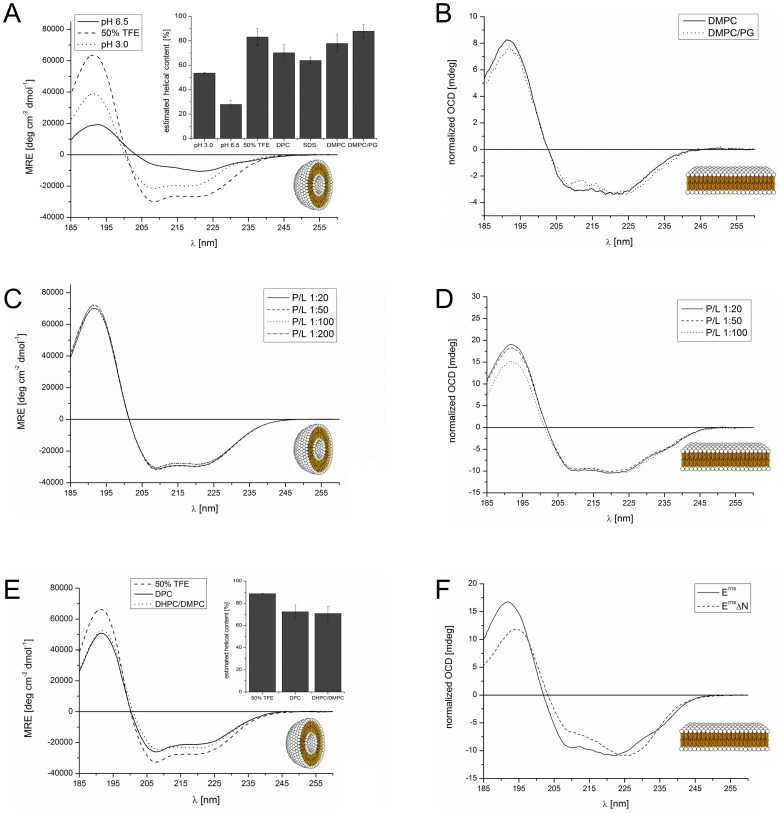
Figure 2. CD and OCD spectra of the Erns C-terminus and the N-terminally truncated version ErnsΔN in different environments.
(A) CD spectra of the Erns membrane anchor (Lys167 – Ala227) in phosphate buffer at pH 6.5 (straight line), at pH 3 (dotted line), or in 50% TFE at pH 6.5 (dashed line). The results of the secondary structure analysis in these environments as well as in detergent micelles and lipoid vesicles are displayed in the inserted bar graph. The bars represent the mean helix content of the Erns anchor calculated with three secondary structure calculation programs (CDSSTR, CONTIN-LL and SELCON-3). (B) OCD spectra of the Erns membrane anchor (Lys167 – Ala227) in oriented lipid bilayers composed of DMPC (straight line), or a mixture of DMPC/DMPG (1∶1) (dotted line), each with a protein/lipid ratio of 1∶100. The spectra were normalized to the same intensity at ∼220 nm to illustrate the similarity in the lineshapes. (C) CD spectra of the Erns membrane anchor (Lys167 – Ala227) in DMPC/DMPG (1∶1) vesicles, recorded at protein/lipid ratios of 1∶20 (straight line), 1∶50 (dashed line), 1∶100 (dotted line), and 1∶200 (dashed-dotted line). (D) OCD spectra of the Erns membrane anchor (Lys167 – Ala227) in oriented lipid bilayers composed of a mixture of DMPC/DMPG (1∶1). The spectra were recorded at protein/lipid ratios of 1∶20 (straight line), 1∶50 (dashed line), and 1∶100 (dotted line). The spectra were normalized to the same intensity at ∼220 nm to illustrate the similarity in the lineshapes. (E) CD spectra of N-terminally truncated ErnsΔN (Arg194 – Ala227) in 50% TFE (dashed line), 10 mM DPC micelles (straight line), and bicelles composed of DHPC/DMPC (4∶1) (dotted line), at a protein/lipid ratio of 1∶100. The results of the secondary structure analysis in these environments are displayed in the inserted bar diagrams. The bars represent the mean helix content of ErnsΔN estimated with three secondary structure calculation programs (CDSSTR, CONTIN-LL and SELCON-3). (F) Comparison of the OCD spectra of the Erns membrane anchor (Lys167 – Ala227) and the N-terminally truncated ErnsΔN (Arg194 – Ala227) in oriented lipid bilayers composed of a mixture of DMPC/DMPG (1∶1) at a protein/lipid ratio of 1∶50. The spectra were normalized to the same intensity at ∼220 nm to allow for a better comparison of the lineshapes.

