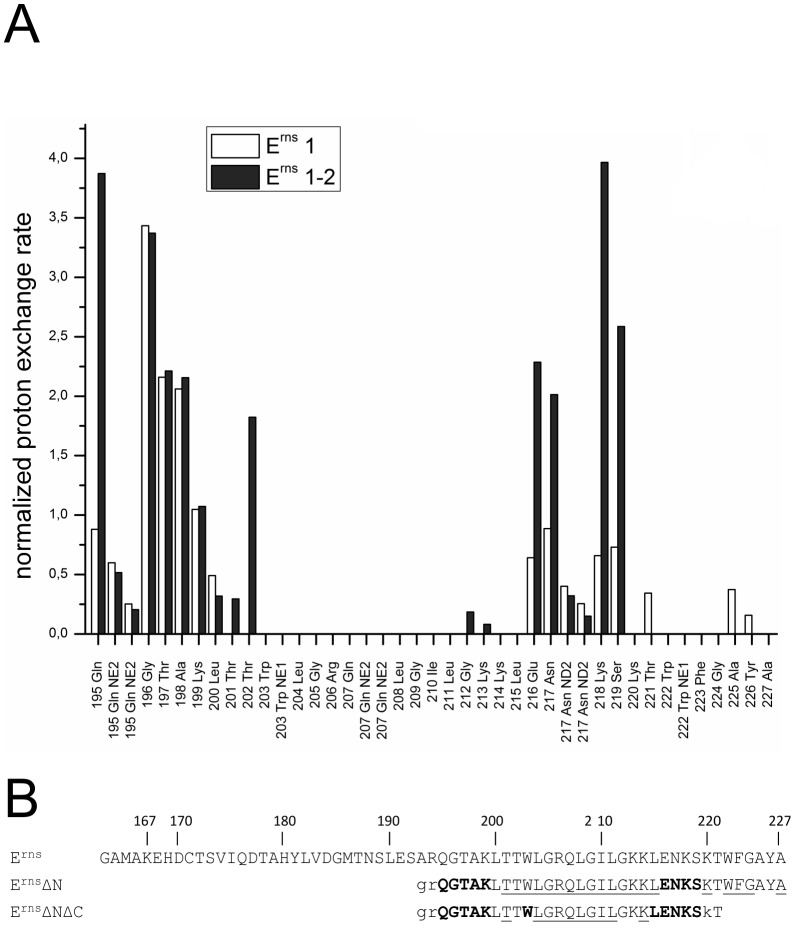
Figure 6. Comparison of the proton exchange rates of ErnsΔN and ErnsΔNΔC.
(A) Normalized proton exchange rates of ErnsΔN (Arg194 – Ala227) and of ErnsΔNΔC (Arg194 – Thr221) for all NH groups identified in the spectra (see Fig. 3C and 5C). (B) The amino acid sequences of the Erns membrane anchor (Erns), the N-terminally truncated protein ErnsΔN, and the N- and C-terminally truncated ErnsΔNΔC are numbered according to the full-length Erns protein. The amino acids of ErnsΔN and ErnsΔNΔC are displayed in different fonts depending on the value of the proton exchange rate of the corresponding peptide NH group. NH groups with a proton exchange rate above of 0.5 are shown in bold face, while those with a proton exchange rate below 0.5 are in standard font. The underlined amino acids were not detected in the CLEANEX spectrum and therefore do not show any significant proton exchange. Unassigned amino acids in the 15N-HSQC spectrum leading to a general lack of information about their water accessibility are presented in lower case.

