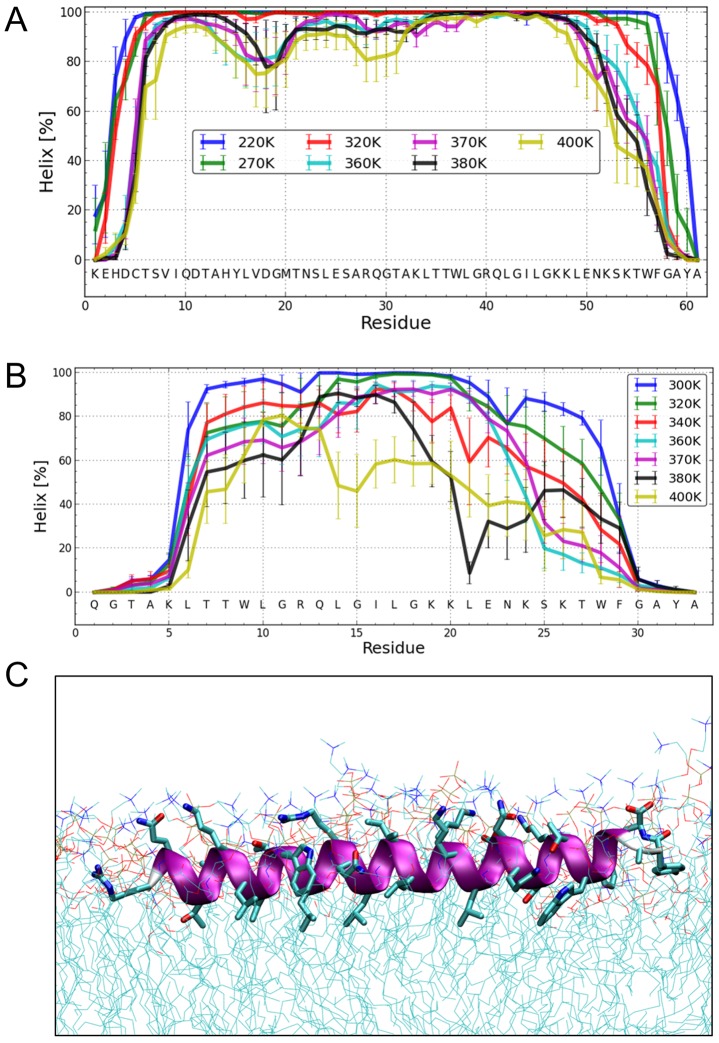
Figure 7. Structure simulations.
(A) MC simulations in an implicit membrane model. Fraction of per-residue helical content at different simulation temperatures for Erns, as determined by the probability of finding a helical secondary structure element at the respective position. The value of the standard deviation is based on five trajectories per temperature. The simulations showed mostly helical conformations for about residues Thr172 to Lys218, whereas the terminal residues appear mostly disordered. (B) MC simulations in an implicit membrane model. Fraction of per-residue helical content at different simulation temperatures for ErnsΔN, as determined by the probability of finding a helical secondary structure element at the respective position. The value of the standard deviation is based on five trajectories per temperature. The simulations showed mostly helical conformations for residues Leu200 to Lys214, whereas the first five N-terminal residues are mostly disordered. With increasing temperature, the region between Leu215 and Phe223 partially unwinds and exhibits loop conformations followed by the helical C-terminus. (C) MD simulation of ErnsΔN (Arg194 – Ala227) at 72 ns in an explicit DMPC membrane. The protein shows a strong helical fold and lies slightly inclined in the hydrophobic region of the membrane just beneath the lipid head groups. The peptide was pulled from an equilibrated position in the membrane surface into the center of the membrane to mimic a more physiological starting position since at least part of the structure should be located within the membrane when the Erns C-terminus is generated by signal peptidase cleavage of the Erns/E1 precursor. In a free MD simulation following the pulling, the peptide exhibited a kink around residue 202 (not shown) until 40 ns, then the peptide was back to the original surface bound orientation and full helicity.

