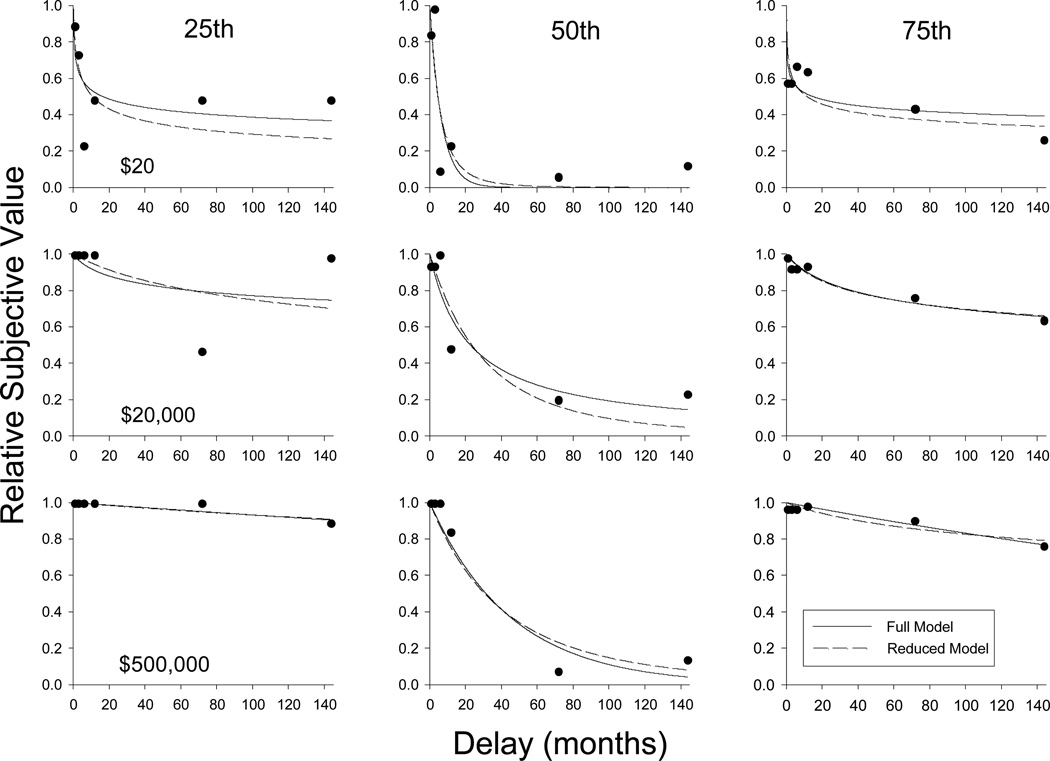
Figure 4.
Relative subjective value as a function of delay in months for representative participants selected on the basis of fits of Equation 1. The left, middle, and right columns show data from participants whose R2s for the full hyperboloid model were at the 25th, 50th, and 75th percentiles (R2s of .83, .89, and .92, respectively). For simplicity, only three amount conditions are shown: $20 (top row of panels), $20,000 (middle row), and $500,000 (bottom row). In each panel, the solid curve represents the fit of the full model; the dashed curve represents the fit of the reduced model.

