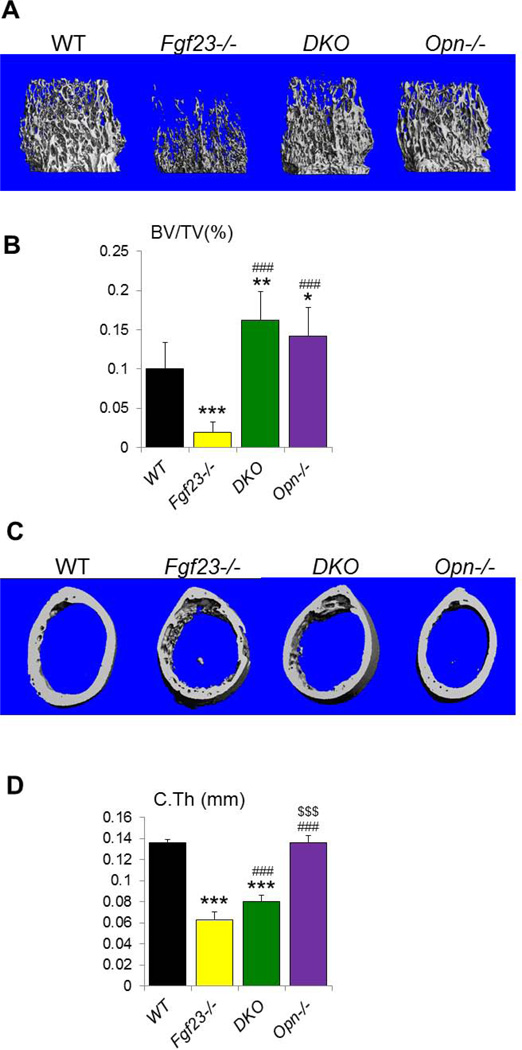
Figure 4. µCT analyses.
(A) Representative images of 3D reconstruction of distal femoral metaphyses. (B) Trabecular bone volume fraction (BV/TV) is significantly increased in DKO. (C) Representative images of 3D reconstructions of midshaft cortical bone. (D) The cortical thickness (C.Th) of DKO bone is improved compared to that of Fgf23−/− bone. Data are presented as Mean ± SD. *: p<0.05, **: p<0.01, ***: p<0.001vs WT; ###: p<0.001vs Fgf23−/−; and $$$: p<0.001 vs DKO.

