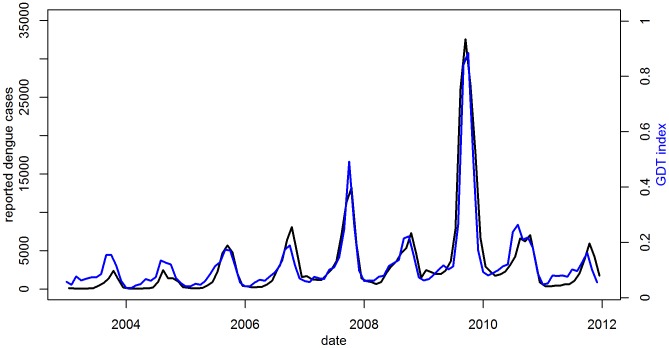
Figure 1. Time Series of monthly reported cases and Google Dengue Trends, Mexico.
2003–2011. The number of cases reported by the Secretariat of Health is shown on the left axis (black) and the GDT index on the right (blue). The correlation coefficient between reported dengue cases and GDT was 0.91 over the 9 years, indicating that GDT captured approximately 83% of the variability in the national surveillance data.

