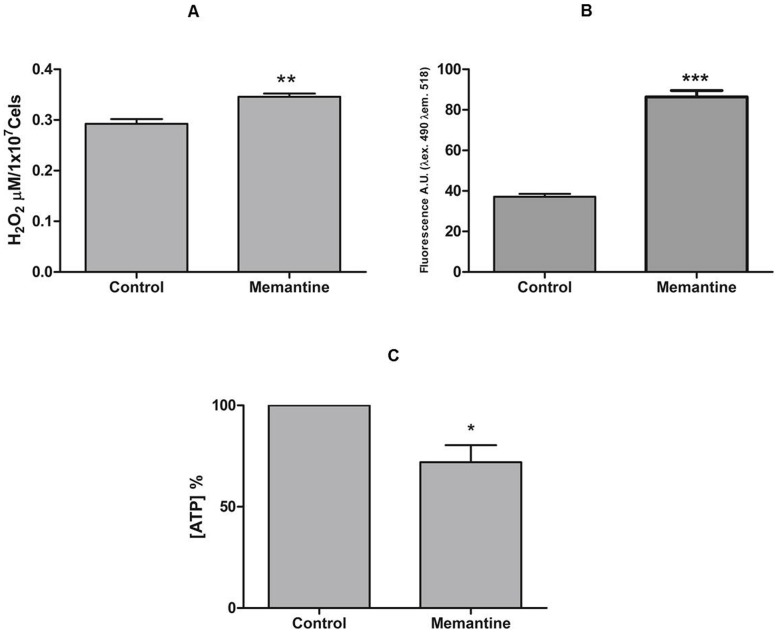
Figure 3. Quantification of H2O2, Ca2+ and ATP levels in T. cruzi.
Panel A: H2O2 levels, parasites treated with Memantine (172.6 µM) or not treated (control) for 24 hours. After this period, the parasites (1.0×10⁷) were incubated with 25 µM amplex red, and 0.05 U mL−1 horseradish peroxidase and analyzed on a fluorometer (λex 563 nm and λem 587 nm). Panel B: Ca2+ levels, parasites were treated for 4 days and incubated with Fluo-4 AM (5 µM) for 1 hour at 28°C, washed twice in HEPES-glucose and evaluated on a fluorometer (λex 490 nm and λem 518 nm). Panel C: ATP levels, parasites were treated for 30 hours, and the levels of ATP were assessed using a bioluminescent assay kit (Sigma-Aldrich) and analyzed on a luminometer (λ 570 nm). T test: *: p<0.05; **: p<0.01; ***: p<0.001.

