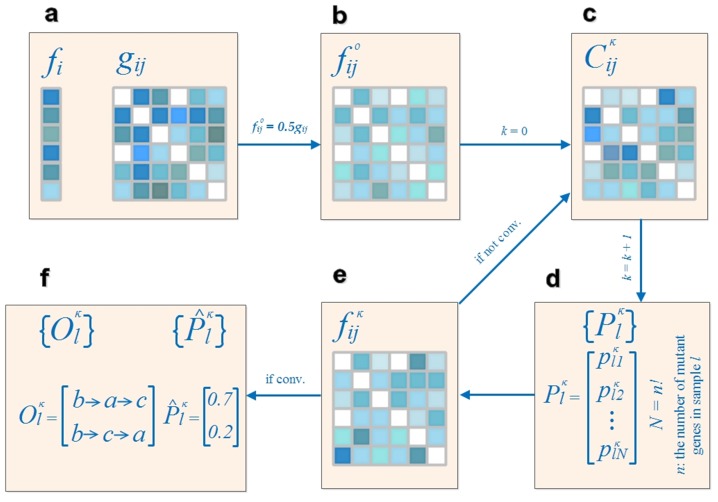
Figure 1. Overview of the inference methodology.
(a) The occurrence and co-occurrence frequencies of the cancer gene mutations  and
and  are determined from available samples, where
  , and
, and  is the number of the cancer genes targeted in the study. An occurrence of a gene will be counted if it is mutated in one of the samples, and a co-occurrence of a pair of genes will be counted if both are mutated in one of the samples; therefore,
  and
and  . (b) Based on the principle of maximum entropy, the initial values of the sequential co-occurrence frequencies are set as
  . (c) The carcinogenesis information conductivities,
  , are calculated from the vector of
  and the matrix of
  . It should be noted that
  might not be equal to
  , implying that the matrix of
  represents a directed network. (d) For each of the
  samples in question, the probabilities of every potential order of the mutant genes in sample
  are computed according to the CICs of each order (Methods). (e) The matrix of
  is redetermined by the matrix of
  and the ratio of the probability-weighted number of the orders indicated that i occurs before j to the number of co-occurrence frequency, it is important to note that
  is not equal to
  in general. If the matrix of
  has not reached the criterion of convergence, the inferred orders will not be regarded as stable and a new loop of the calculation of
  and
and  will be performed. Otherwise (f), the orders with a probability higher than random chance and the corresponding probabilities
  and
and  are regarded as the referred results. For example, of all 6 potential orders for a sample with three mutant cancer genes a, b and c, orders
  and
and  are identified as the probable ones due to probabilities of 0.7 and 0.2 (higher than a random chance of 1/6).

