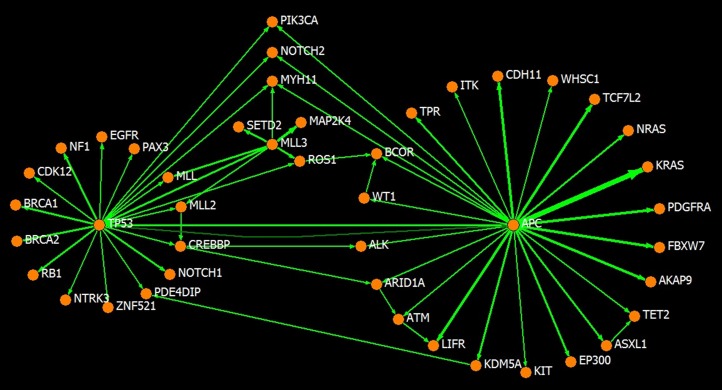
Figure 4. An illustration of the asymmetry of CIC-linked cancer gene networks.
Forty-four frequently mutated cancer genes (in more than 20 genome-wide scanned samples in the COSMIC database) are illustrated with the CICs between them larger than 1.0E-2. The thickness of the link is proportional to the strength of the corresponding CIC. When a pair of genes has bidirectional links, the stronger link is drawn as a straight line and the weaker one is drawn as a curved line (see the case of APC ←→TP53). The asymmetry can be observed by the fact that no bidirectional links of similar strengths exist between gene pairs, and APC, TP53, and MLL3 each play a hub role in the network.

