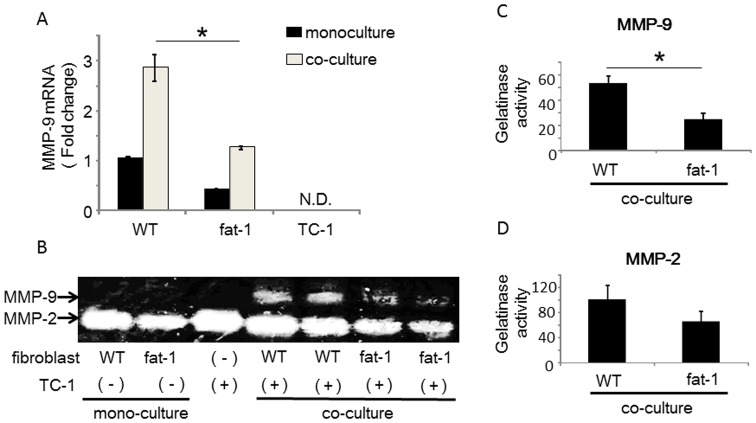
Figure 5. The increased MMP-9 expression and activity in TC-1/fibroblast co-cultures is inhibited in fat-1 mice.
(A) Isolated fibroblasts were co-cultured with TC-1 cells for 24 hours and expression levels of MMP-9 in the fibroblasts were measured by RT-qPCR. Expression levels of MMP-9 were normalized to β-actin as an internal standard. The data are representative of three independent experiments. The data were analyzed using the Student's t-test. Asterisks indicate those comparisons (fat-1 vs. wild type (WT) mice) with statistical significance (p<0.05). “N.D.” indicates ‘not detected’. (B) Gelatin zymography: Supernatants from fibroblast homotypic cultures and fibroblast/TC-1 co-cultures were collected and separated by electrophoresis. Gelatinase activities were visualized by standard staining techniques. (C, D) For semi-quantitative analyses, gelatin zymography bands were analyzed using image analysis software. Results are represented as mean ±SEM of three independent experiments. The data were analyzed using the Student's t-test. Asterisks indicate those comparisons (fat-1 vs. wild type (WT) mice) with statistical significance (p<0.05).

