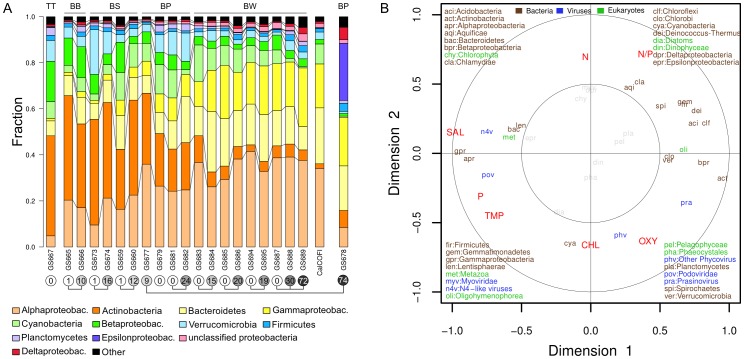
Figure 2. Salinity-driven shifts in bacterial community composition.
A) Bacterial communities characterized by AMPHORA2. The 12 most abundant groups are shown with “Other” defined as the remaining taxonomic groups. Sequences have been combined for all non-viral size fractions (0.1, 0.8 and 3.0 µm) with normalization for genome equivalents. Sampling depth (m) is indicated within circles below sample names, with interconnecting circles indicating samples from the same location. The corresponding basin for samples is shown in the top margin: TT = Torne Träsk, BB = Bothnian Bay, BS = Bothnian Sea, BP = Baltic Proper, BW = Baltic West. A merged set of metagenomes from the coastal eastern Pacific (CalCOFI) was included for comparison. B) RCCA analysis of community composition. The biplot shows correlations between environmental (red) and phylogenetic (color coded by superkingdom) variables with the corresponding first and second canonical variates. The first two canonical variates explain 65% of the environmental variables and 49% of the organismal variables. Biplots for a RCCA at the genus level is shown in figure S5. The outer circle (1) and inner circles (0.5) display the amount of variance explained by the linear combinations of variables. The variance explained for points within the inner circle is less than 25%, thus these have been dimmed.

