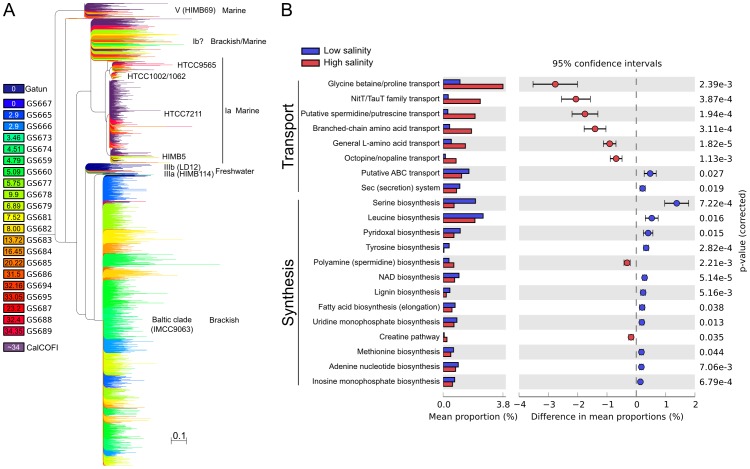
Figure 4. Baltic Sea SAR11 phylogeny and function.
A) Metagenomic sequences classified as SAR11 placed onto a reference tree built from 31 concatenated core genes (see Methods). The Rickettsiales sister group (not shown for clarity) of Candidatus Pelagibacter was chosen as outgroup from AMPHORA2 reference trees. Terminal branches are colored according to the legend in the left margin. Sequences with likelihood weights<0.9 were pruned from the tree. Branches corresponding to sequences from the freshwater Lake Gatun and coastal California metagenomes are colored purple and dark blue, respectively. Numbers in the boxes indicate salinity (PSU). B) Functional differences between the low and high salinity SAR11 populations. Plot of differences in KEGG categories related to biosynthesis (“Synthesis”) and transport (“Transport”) of amino acids, nucleotides and cofactors. Bar plots show mean proportions for each category in the different populations and the confidence interval. Welch's t-test p-values (corrected using the Bonferroni method) are shown in the right margin of the plot.

