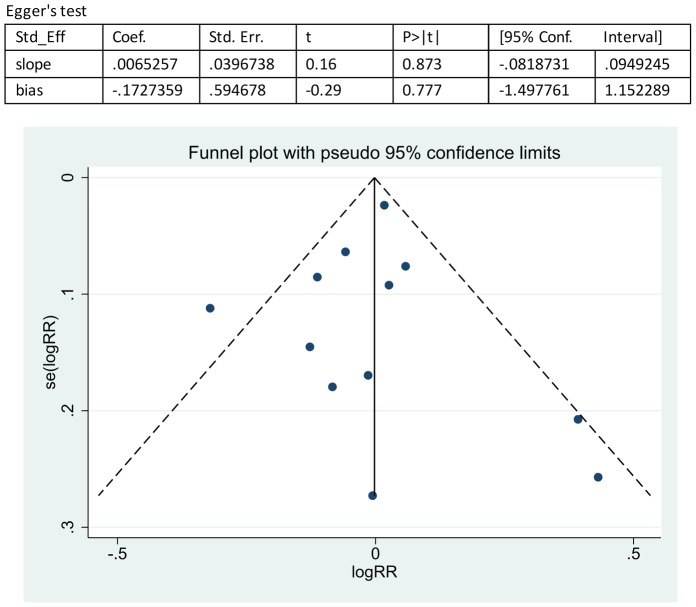
Figure 4. Overall analysis of publication bias on the effect of RF status on the response to anti-TNFα treatment.
Egger's linear regression test was performed to quantify publication bias. The p values of the RF status analysis were 0.777. The funnel plot showed no significant evidence of asymmetry.

