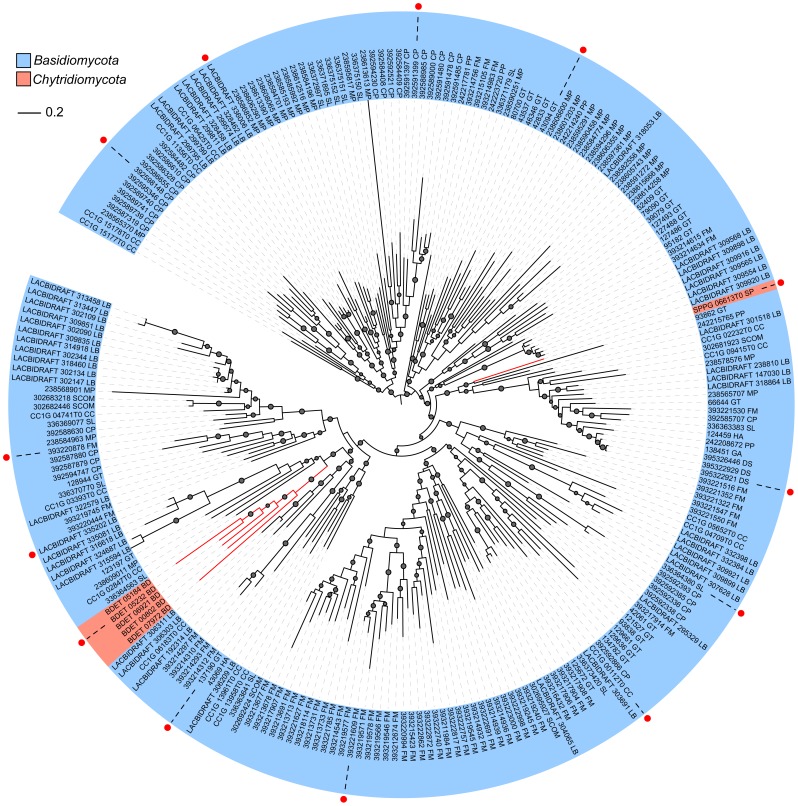
Figure 4. The maximum likelihood tree of FslK members.
The phylogenetic tree was built with the kinase domain sequences using PhyML 3.1 and was drawn using Interactive Tree Of Life Version 2.2.2 (http://itol.embl.de/#). The p-values of approximate likelihood ratios (SH-aLRT) plotted as circle marks on the branches (only p-values>0.5 are indicated) and circle size is proportional to the p-values. Filled red circles mark sequences used in the Figure 2. For abbreviations see Table S1.

