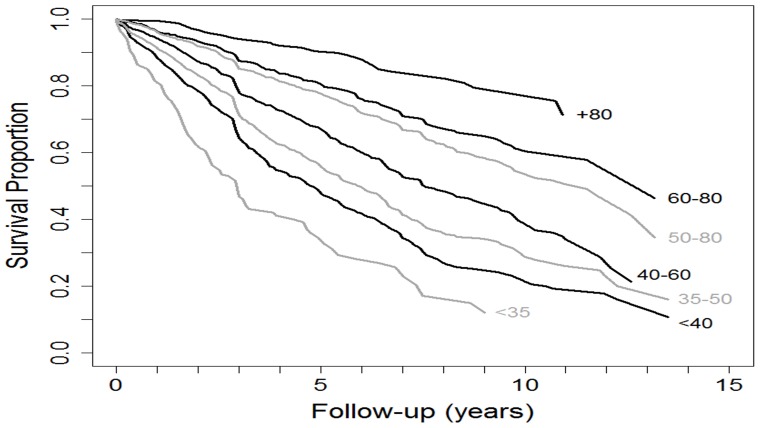
Figure 1. Kaplan-Meier survival curves for different thresholds of FEV1 up to 15 years.
Hazard ratios and 95% confidence intervals for different thresholds of FEV1 :1) >80% reference group, 2) 60–79% (1.5; 1.06–2.11), 3) 50–79% (1.74; 1.25–2.43), 3) 41–59% (2.38; 1.7–3.32),4) 35–49% (2.92; 2.1–4.07),5)<40% (3.54; 2.53–4.95), 6)<35% (5.18; 3.53–7.61)

