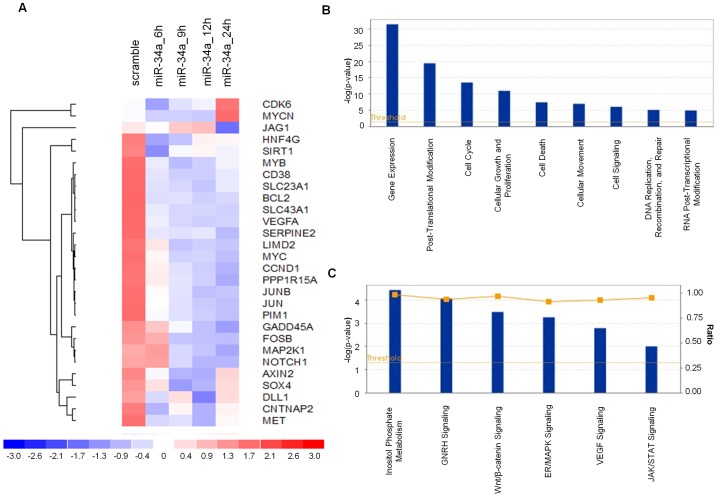
Figure 1. Whole Gene profiling perturbations induced by synthetic miR-34a.
A) Heatmap representation of the top 28 down- and up-regulated genes (P<0.001) following miR-34a or miR-NC transfection in SKMM-1 cells by Gene 1.0 ST array chip (Affymetrix) and DChip software. Data are presented row normalized (range from −3 to +3 standard deviations from median in expression). Genes that underwent a 1.5-fold change as compared to control, were selected and clustered. Assays performed in triplicate are shown. Ingenuity Pathway analysis of biological function annotation B) and canonical pathways C) for differential expressed gene (FC = +1.5) after miR-34a transfection respect to the miR-NC control. The bar graphs show pathways most modulated by miR-34a inhibitors as compared to control, based on statistical significance (P-value and ratio). The yellow line indicates the threshold of significance.

