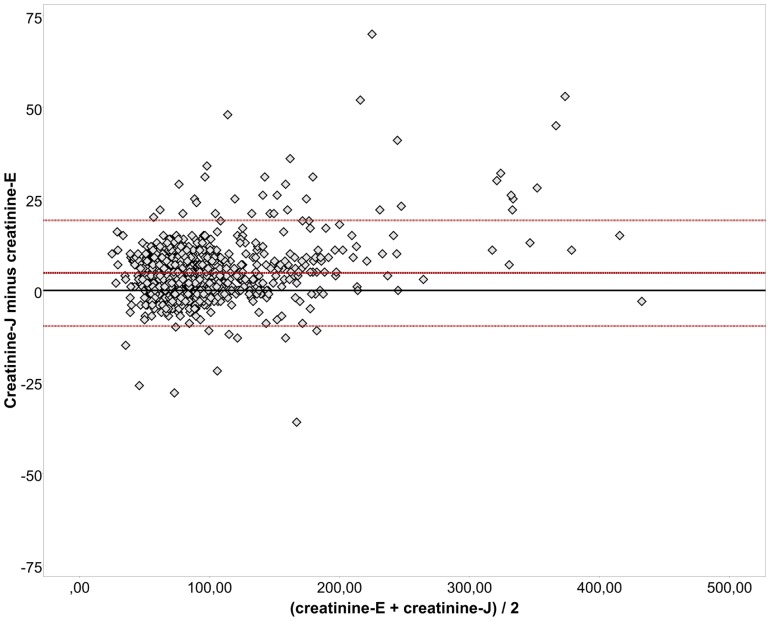
Figure 1. Bland-Altman-plot shows the differences between the creatinine measurements determined using the Jaffé method (creatinine-J) and the enzymatic method (creatinine-E) versus the mean measurements of both methods.
The horizontal reference lines show zero difference, the average difference between the measurements and the measurements plus and minus a 1.96-fold standard deviation [10].

