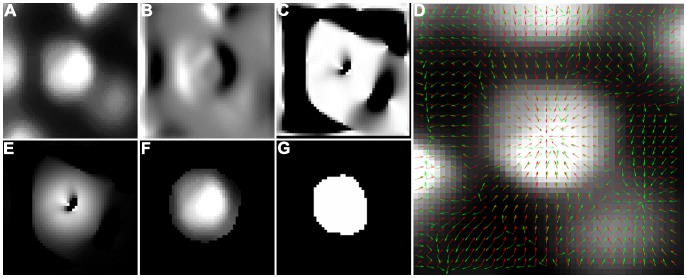
Figure 2. Processing steps that are performed in parallel for each detected seed point.
Cropped raw image (A), Gaussian smoothed left-right derivative image (B), dot product of the normalized gradient with the seed normal (C), raw image with smoothed gradient and normal vector field overlay (D), weighted version of the previously calculated dot product (E), resulting intensity image (F) and the final segmentation result (G).

