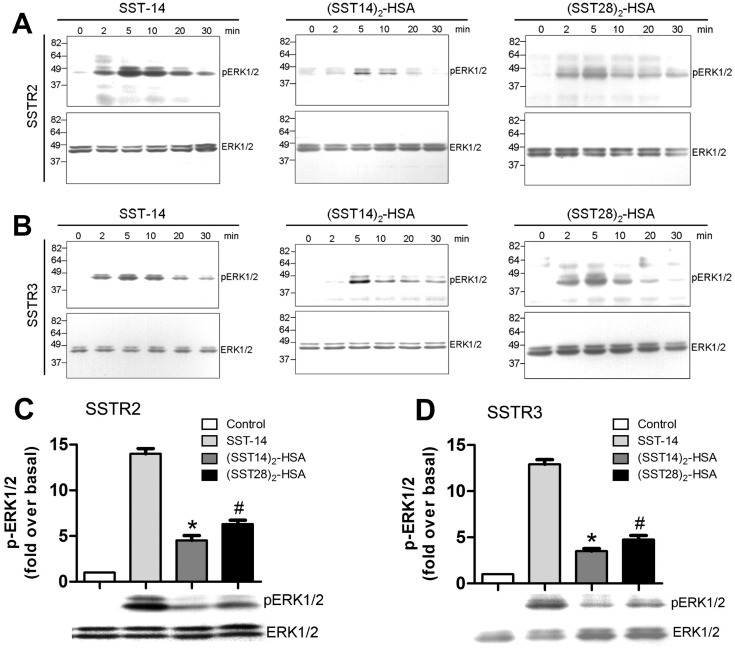
Figure 4. Comparison of SST-14-, (SST14)2-HSA- and (SST28)2-HSA-induced ERK activation in SSTR2- and SSTR3-expressing cells.
(A, B) Time-dependent ERK1/2 activation. HEK 293 cells expressing SSTR2 or SSTR3 were exposed to 1 µM SST-14, (SST14)2-HSA, or (SST28)2-HSA for 0, 2, 5, 10, 20, or 30 minutes. Cells were lysed, equal amounts of protein were resolved by SDS-PAGE, and levels of total ERK1/2 and phosphorylated ERK1/2 were determined by immunoblotting. Two additional experiments gave similar results. (C, D) Agonist-induced ERK1/2 activation. HEK 293 cells expressing SSTR2 or SSTR3 were exposed to 1 µM SST-14, (SST14)2-HSA or (SST28)2-HSA for 5 minutes. The cells were lysed, equal amounts of protein were resolved by SDS-PAGE, and the levels of total ERK1/2 and phosphorylated ERK1/2 were determined by immunoblotting. Results were quantified by densitometric analysis. The data were normalized to total ERK1/2 and expressed as the fold ERK1/2 phosphorylation over the basal value in untreated cells. The values represent the means ± S.E. of three independent experiments performed in duplicate. *, p<0.01, (SST14)2-HSA-treated cells compared with SST-14-treated cells. #, p<0.01, (SST28)2-HSA-treated cells compared with SST-14-treated cells.

