
Figure 2. The “sign rule” may fail to identify the globally optimal correlations.
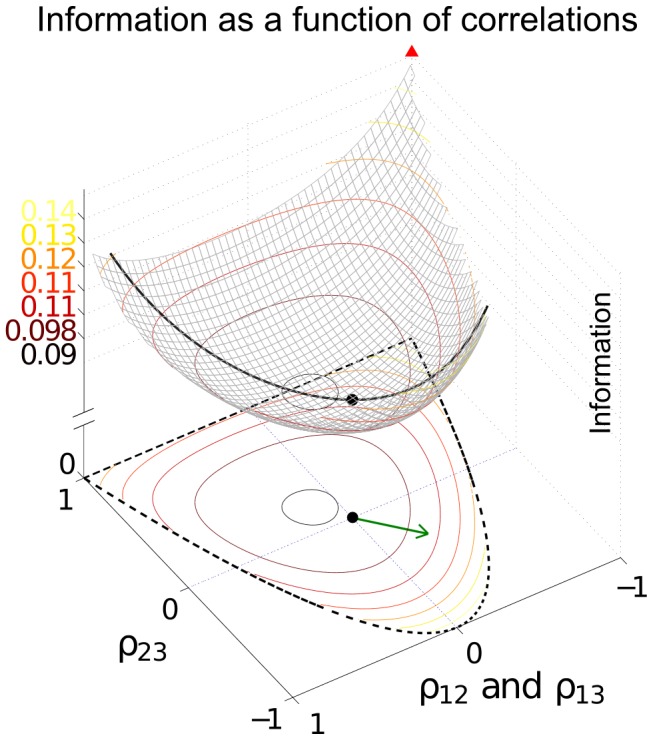
The optimal linear estimator (OLE) information  (Eq. (12)), which is maximized when the OLE produces minimum-variance signal estimates, is shown as a function of all possible choices of noise correlations (enclosed within the dashed line). These values are
  (x-axis) and
  (y-axis) for a 3-neuron population. The bowl shape exemplifies the general fact that
  is a convex function and thus must attain its maximum on the boundary (Theorem 2) of the allowed region of noise correlations. The independent noise case and global optimal noise correlations are labeled by a black dot and triangle respectively. The arrow shows the gradient vector of
  , evaluated at zero noise correlations. It points to the quadrant in which noise correlations and signal correlations have opposite signs, as suggested by Theorem 1. Note that this gradient vector, derived from the “sign rule”, does not point towards the global maximum, and actually misses the entire quadrant containing that maximum. This plot is a two-dimensional slice of the cases considered in Fig. 3, while restricting
  (see Methods Section “Details for numerical examples and simulations” for further parameters).