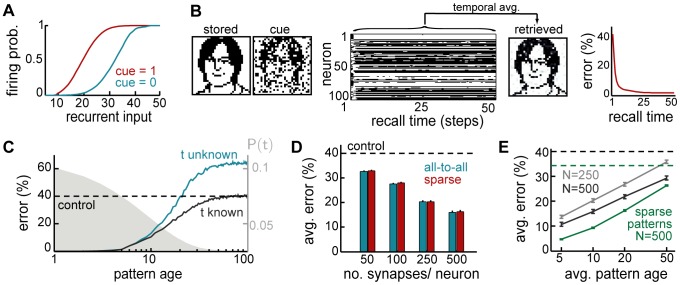
Figure 2. Optimal recall.
A. Optimal neural transfer function: the total somatic current combines the recurrent contribution and a persistent external input corresponding to the recall cue. B. An example retrieval trial, from left to right: the pattern to be retrieved; the recall cue; activity of a subset of neurons during retrieval; final answer to the retrieval query obtained by temporally averaging the activity of the population; evolution of r.m.s. retrieval error over time in a trial. C. Recall performance as a function of pattern age (blue). As a reference, performance when the age of the pattern is known to the network is also shown (black, see Text S3). Gray filled curve shows distribution of retrieval times. D. Average performance as a function of the number of synapses per neuron in fully connected networks of different sizes (blue), or a sparsely connected network of fixed size  varying the number of connections (red). E. Average performance as a function of average pattern age in fully-connected networks of different sizes for balanced patterns (coding level =
  , black, gray), and sparse patterns (coding level =
  , green). Dashed lines in panels C–E show, as a control, the performance of an optimised feed-forward network without synaptic plasticity (see main text for why this is a relevant upper bound on average recall error).

