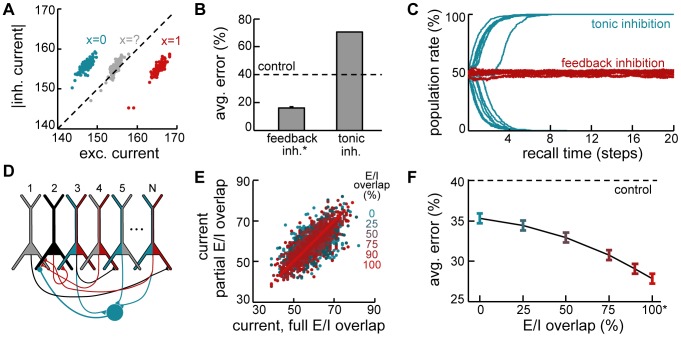
Figure 5. Dynamic feedback inhibition.
A. Example statistics of inhibitory vs. excitatory currents to three example neurons during a recall trial. Blue: neuron correctly recalling a  bit in the originally stored pattern, correctly recalled; red: neuron correctly recalling a
  bit in the originally stored pattern; gray: neuron with high variability during the trial, corresponding to an incorrectly recalled bit. Individual dots correspond to different time steps within the same recall trial. B. Effect of replacing feedback inhibition by tonic inhibition with the same average level. C. Evolution of the mean population activity during retrieval when network dynamics involve feedback (red) versus tonic inhibition (blue). Lines correspond to different trials. D. Schematic view of inhibitory connectivity in the network. Pyramidal neurons sending or receiving monosynaptic excitation (disynaptic inhibition) to example neuron 2 (black) are colored red (blue). Blue circle: local interneuron (not explicitly modeled) mediating disynaptic lateral inhibition received by neuron 2. E/I overlap is measured as the ratio of presynaptic pyramidal neurons colored both blue and red, 0% is chance. E. Total somatic current (through recurrents) to an example cell in a sparsely connected network (20% connectivity) with full (x-axis) or partial E/I overlap (y-axis, colors); different points correspond to different time steps. F. Recall performance as a function of E/I overlap. Asterisks in B and F indicate network configurations that are formally equivalent to the exact dynamics.

