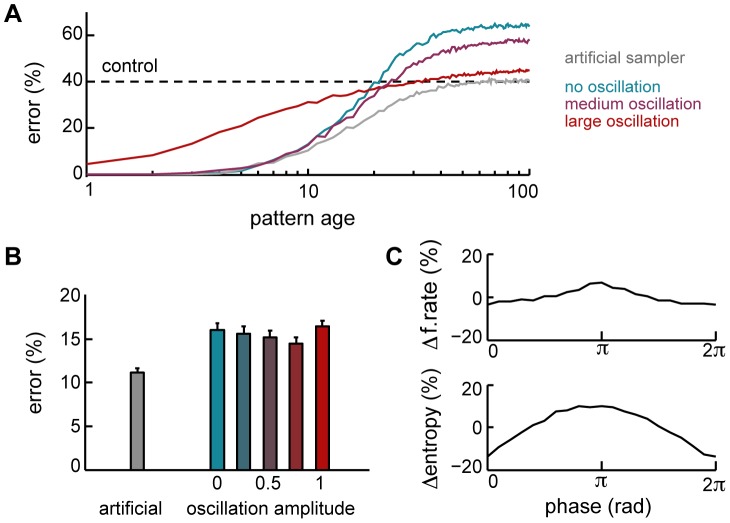
Figure 7. Population oscillations.
A. Recall performance as a function of pattern age with optimal network dynamics without oscillations (blue, cf. Fig. 2C), with medium- (purple) or large-amplitude (red) oscillations, and with an artificial sampling algorithm (gray). B. Average recall performance with the artificial sampling algorithm (gray) and with different levels of amplitude modulation for network oscillations (amplitude 0.75 corresponds to the ‘medium oscillation’ in panel A). C. Average normalised population activity and response entropy at different phases during a cycle of a large-amplitude oscillation.

