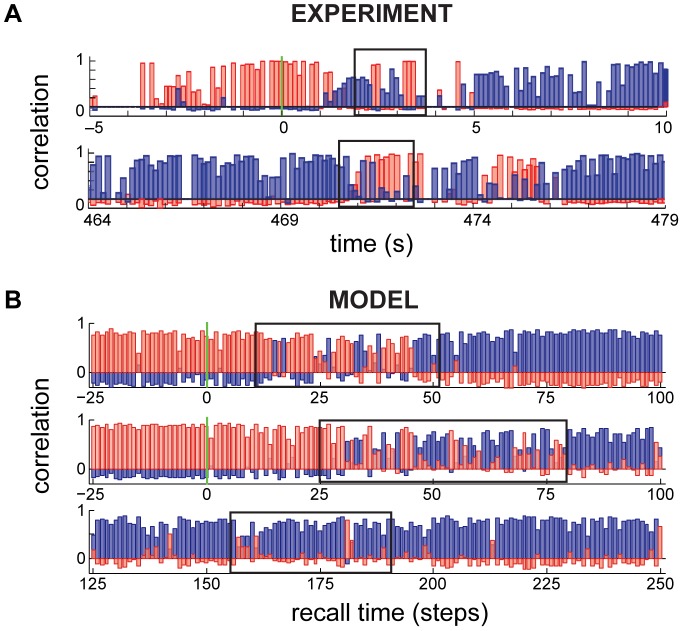
Figure 8. Network flickering.
A. Hippocampal population dynamics during a single retrieval trial, reproduced from Ref. [46]. Correlation of the instantaneous population vector to the stereotypical responses of the network in the two contexts are shown (red vs. blue) Top: flickering (box) following the switching of visual cues at time 0 (green vertical line), bottom: spontaneous flickering (box) without external cue switching. B. Dynamics of population responses in the model showing flickering (boxes) after cue switching (top), and spontaneously, without cue switching (bottom).

