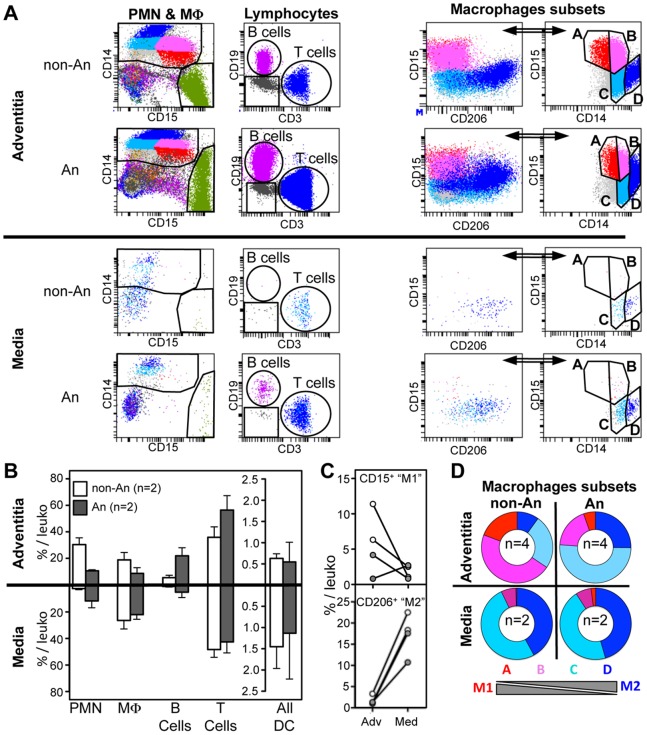
Figure 3. Comparison of leukocyte subsets in the adventitia and the media from non-aneurysmal and aneurysmal abdominal aortas.
(A) Flow cytometric dot plots defining polymorphonuclear cells (PMN) and macrophages (MΦ, far left dot plots), CD3+ T cells and CD19+ B cells (middle left dot plots), and macrophages subsets (right dot plots) in the adventitia (upper panels) and the media (lower panels) from a non-aneurysmal (non-An) and an aneurysmal (An) abdominal aorta. (B) On the left, graphical representation of the percentages among total CD45+ leukocytes of PMN, macrophages, B cells, T cells and all DC in the adventitia (n = 2, upper histograms), and the media (n = 2, lower histograms) from non-An (white histograms) and An (grey histograms) aortas. (C) Comparison between the adventitia (Adv) and the media (Med) for the percentages among total CD45+ leukocytes of CD15+ and CD206+ macrophage subsets in non-An (white filled circles) and An (grey filled circles) aortas (lines associates paired results obtained in the adventitia and the media from the same patient). (D) Ring graphical representation of the proportion of the macrophage subsets defined in Figure 2A among total macrophages in the adventitia (n = 4, top panels) and the media (n = 2, bottom panels).

