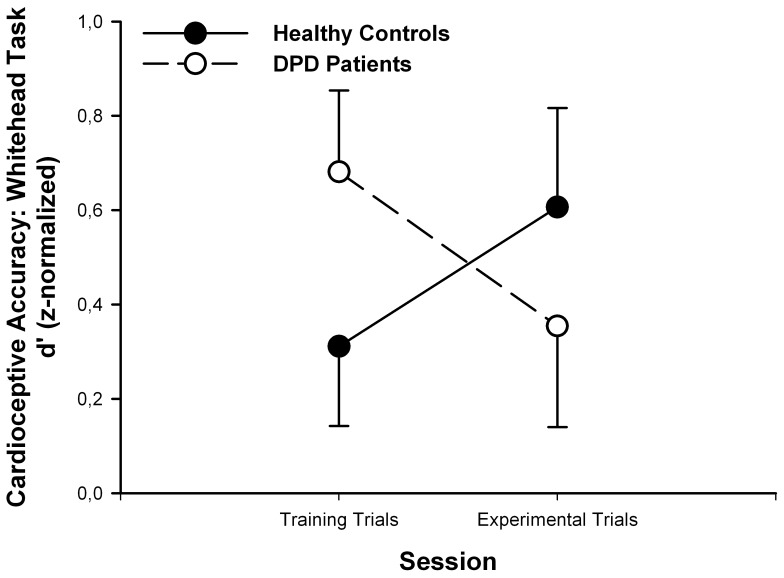
Figure 1. Change of the performance in the Whitehead task from the training to the experimental trial between the two groups.
Circles indicate means and error bars correspond to standard error of mean (SEM). There were no significant within or between group differences regarding CAWhitehead. However, the two groups differed significantly regarding the direction of their changes (F(1,43) = 4.359, p = 0.043).

