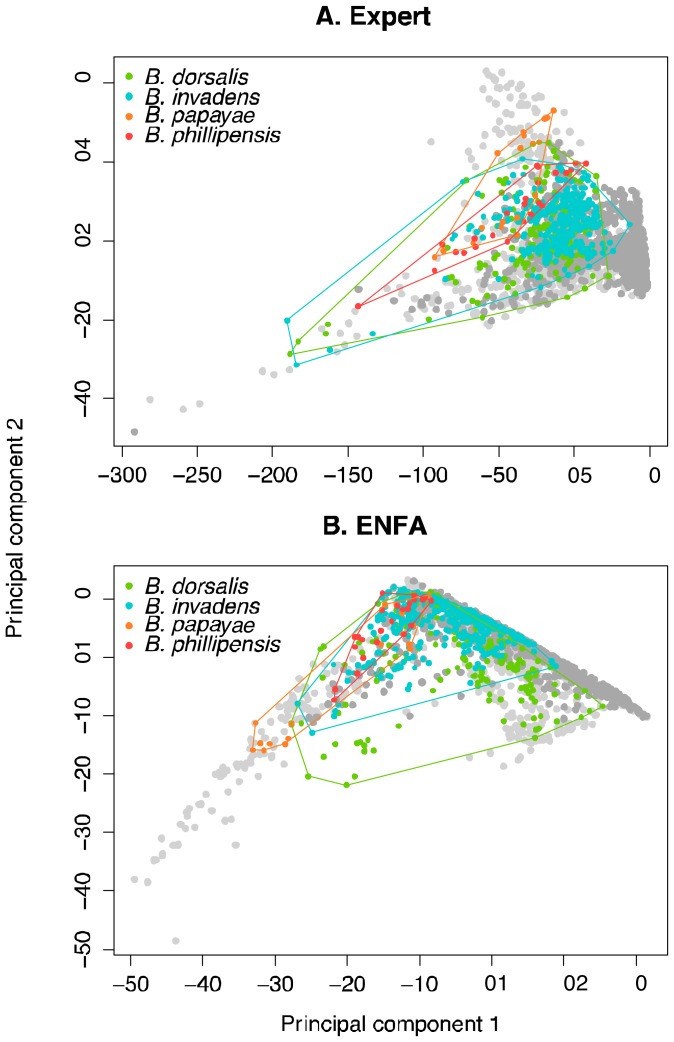
Figure 2. Principal components analysis (PCA) of four different Bactrocera spp. across different predictor variable sets.
Light grey points represent 1000 random background points across the range of B. dorsalis s.s. and dark grey, B. invadens. a) PCA for “expert” predictor set. Proportion of variance for PC1 = 88.8% and for PC2 = 6.4%. b) PCA for ENFA driven predictor set (note: eight variables were loaded, most informative across the 4 “species”) Proportion of variance for PC1 = 68.4% and for PC2 = 24.6%.

