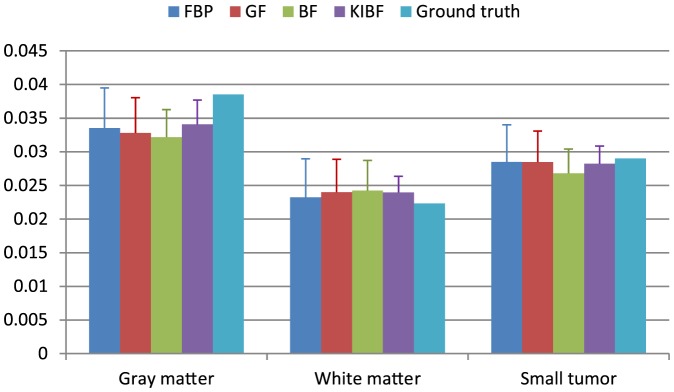
Figure 9. Box plots of the mean value of  with standard deviations in the gray matter, white matter and small tumor regions from different algorithms.

