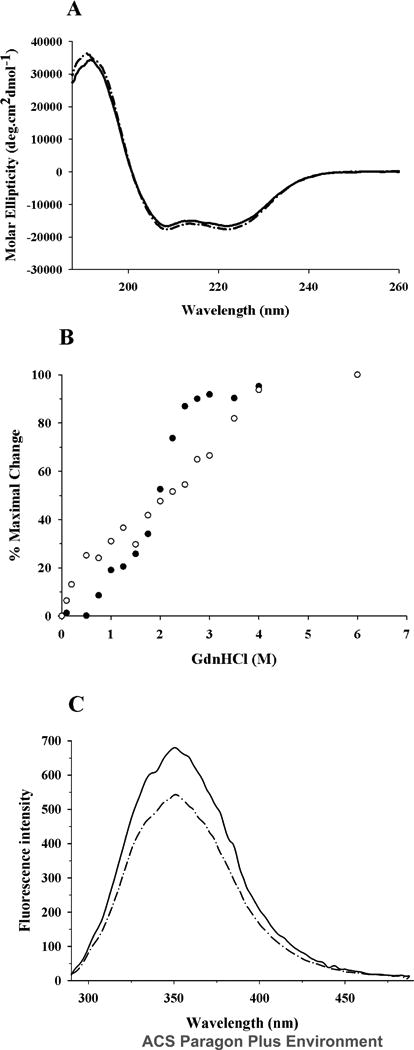
Figure 4. Effect of acrolein modification on secondary structure and tertiary fold of apoE.

A. Far-UV CD spectra. The spectra of unmodified (solid line) and acrolein-modified apoE (dashed line) (0.2 mg/ml) were recorded in 20 mM sodium phosphate buffer, pH 7.4. The scans were obtained from 185 to 260 nm using a 0.1 cm path length cuvette, scan speed of 20 nm per minute, and response time of 1 second (average of 3 scans shown). B. GdnHCl-induced unfolding. The % maximal change in ellipticity of 0.2 mg/ml unmodified (filled circles) and acrolein-modified (open circles) apoE at 222 nm was plotted as a function of increasing GdnHCl concentration. The % maximal change was calculated using eqn. 3. C. Fluorescence emission spectra. Fluorescence emission spectra of unmodified (solid line) and acrolein-modified apoE (dashed line) (0.02 mg/ml) were recorded in PBS. Emission scans were recorded between 290 and 490 nm following excitation at 280 nm (5 nm excitation and emission slit widths).
