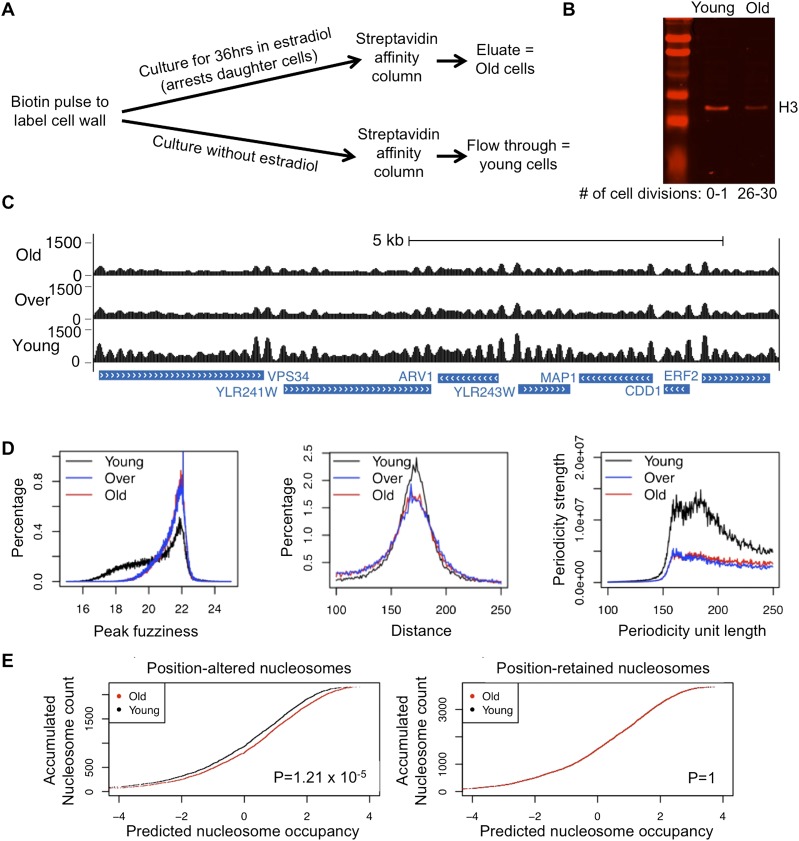
Figure 1.
(A) Schematic diagram of the purification of old and young cells. (B) Old cells isolated using the MEP were analyzed for histone H3 protein levels in comparison with young cells. Equivalent numbers of old and young cells (strain ZHY2) were analyzed by Western blotting. The number of cell divisions was determined by counting bud scars after calcofluor staining. (C) MNase-seq data for a typical region of the genome. “Over” refers to an old sample with overexpressed H3/H4. (D) Distribution of nucleosome fuzziness scores, neighboring distances, and occupancy periodicities. Periodicity was calculated based on the power spectrum density analysis algorithm (Chen et al. 2008, 2010). (E) Accumulated nucleosome count plotted relative to sequence-predicted nucleosome occupancy. (Left) Plot for nucleosomes with positions shifted up to 100 bp and not <50 bp in old cells relative to young cells. (Right) Plot for nucleosomes whose positions are the same in old and young cells; therefore, the curves for the old and young cells completely overlap with each other. P-values are calculated based on KS test between the distributions of nucleosome occupancy values in old and young cells.

