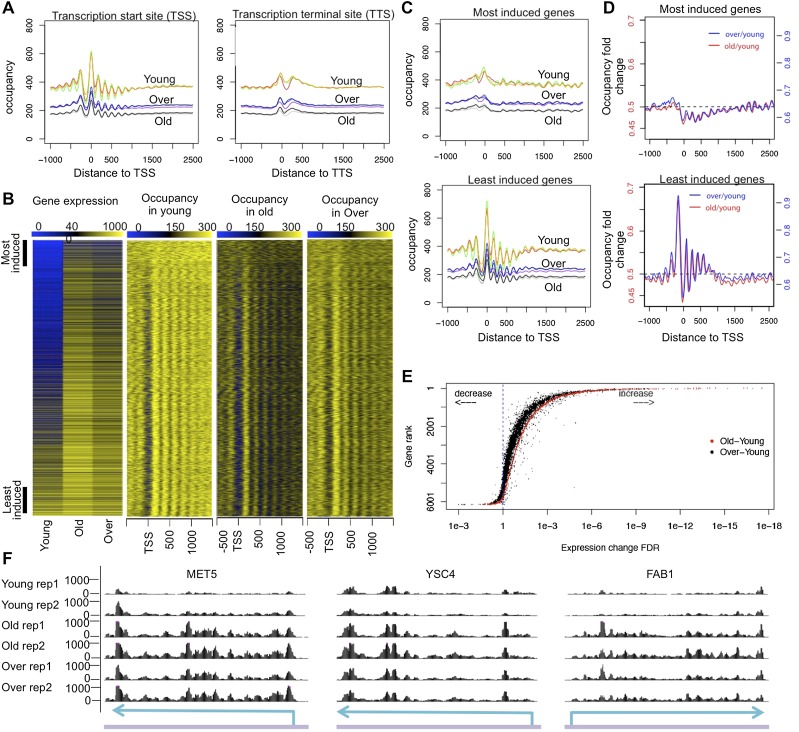
Figure 2.
(A) Nucleosome occupancy normalized based on spike-in control for all genes plotted relative to the TSS and TTS. All three replicates are plotted for each cell group. (B) Gene expression changes during aging are plotted from the RNA-seq analysis. Nucleosome occupancies for the same genes are shown on the right. Genes are ranked by the false discovery rate (FDR) of expression difference between old and young cells, with most induced genes on the top and least induced genes at the bottom. (C) Nucleosome occupancy plotted relative to the TSS; the top and bottom 500 genes ranked by expression up-regulation during aging are defined as most induced and least induced gene groups, respectively, and are plotted separately. (D) The fold change of nucleosome occupancy plotted relative to the TSS. Independent scales on the Y-axis are used to plot for old–young and over–young fold change. Horizontal dashed line indicates average fold change over all yeast genes. (E) Rank of gene expression change during aging plotted relative to the FDR value of gene expression change during aging (red) and during aging in the presence of H3/H4 overexpression (black). (F) RNA-seq data for three typical genes: MET5, YSC4, and FAB1. “Over” refers to an old sample with overexpressed H3/H4. Sky-blue arrows over a purple line indicate gene locus on genomic DNA, respectively.

