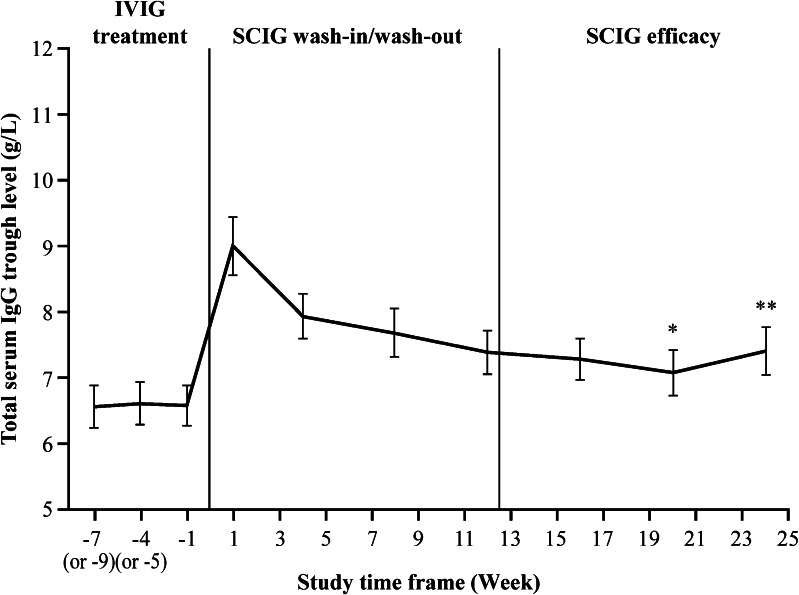
Fig. 3.
Mean total serum IgG trough levels (PPS). Mean total serum IgG trough levels are shown for the PPS (N = 21). The number of patients with available IgG levels differed from the original patient number in the PPS at Week 20 (N = 20; *) and Week 24 (N = 18; **). Error bars represent the standard error of the mean

