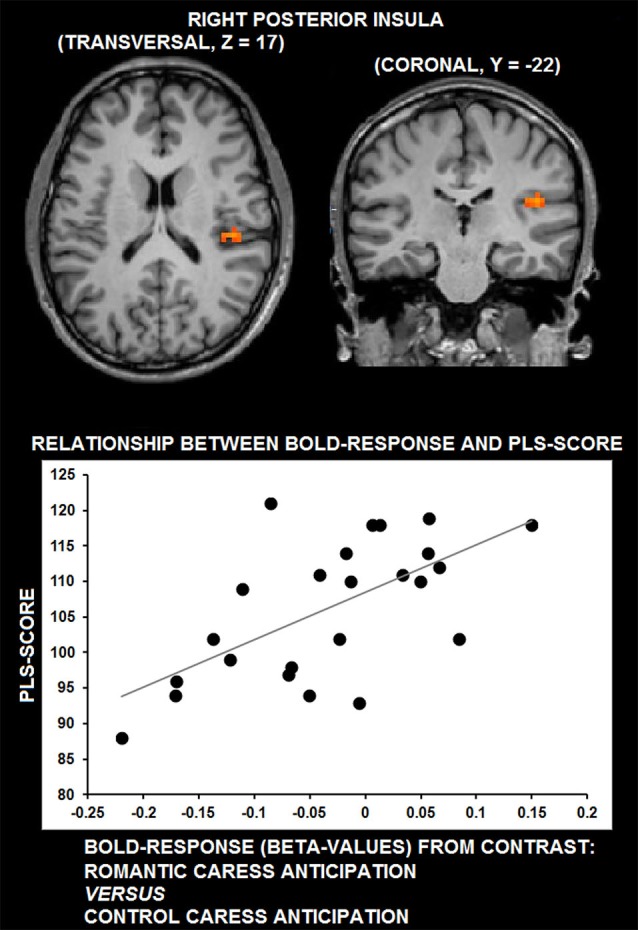
Figure 3.

Group statistical maps of right posterior insula activity covarying with PLS scores (thresholded at p < 0.01 corrected, corresponding to r > 0.63), and scatter plot depicting the correlation between anticipatory BOLD-response for romantic caress in posterior insula and PLS scores.
