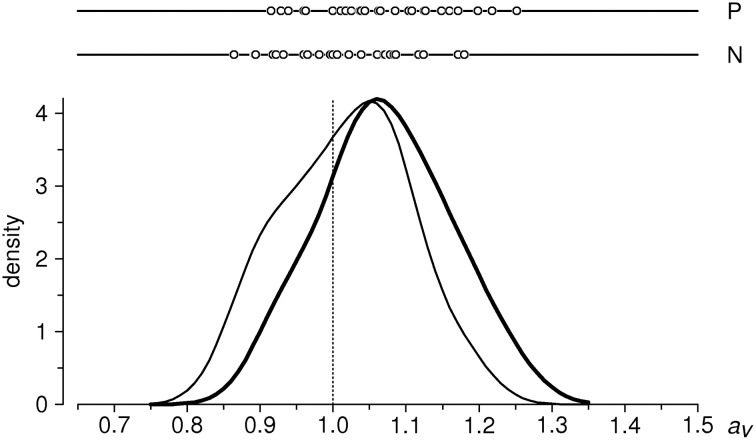
Figure 3.
Distributions of aggregated ratio indices aP and aN in the entire sample (n = 31 subjects). Upper part: individual data points; below: estimates of probability density functions (thin curve: an, thick curve: ap), obtained with a Gaussian kernel (Silverman, 1986) of bandwith σ = 0.04. Vertical dotted line indicates the null-hypothesis-based expectation.

