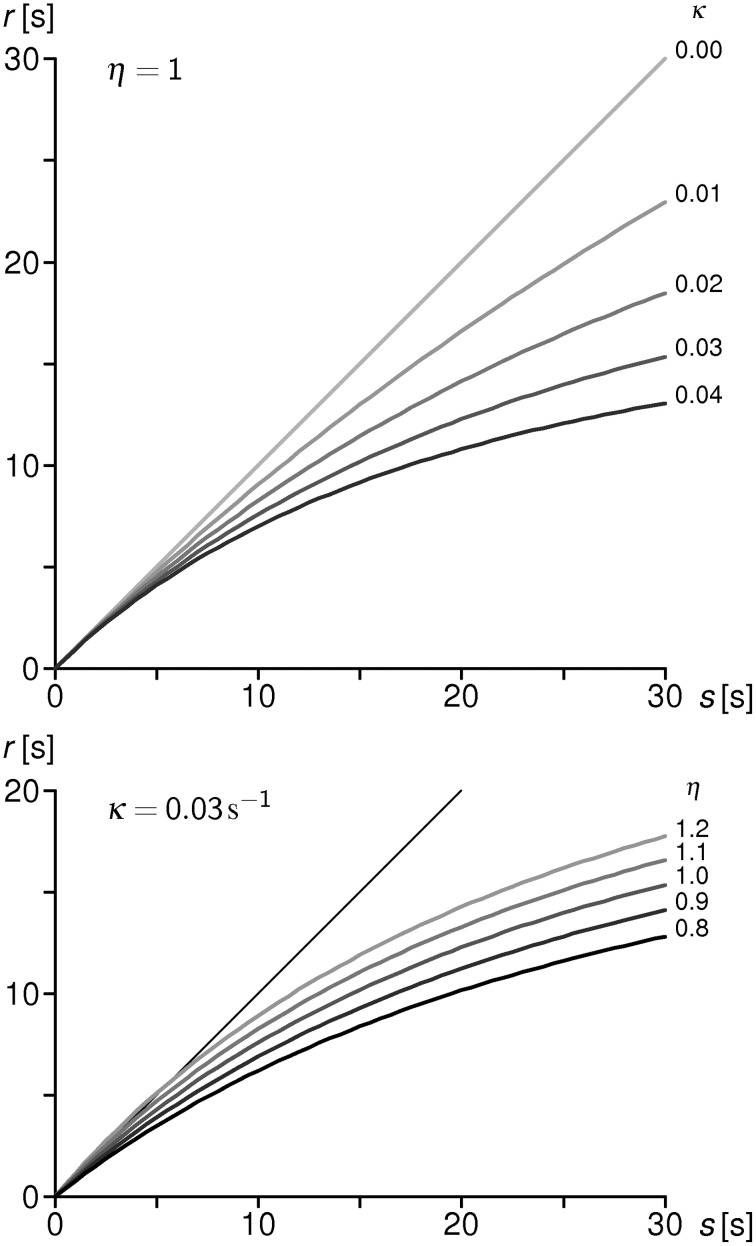
Figure A1.
Upper part: different forms of the krf for η = 1 (equal inflows) and κ varied from 0 to 0.04 with step 0.01. The higher the loss coefficient κ, the more pronounced is the krf curvature, i.e., the progressive shortening with increasing duration s. Lower part: different forms of the krf for a constant value of κ = 0.03 and η varied from 0.8 to 1.2 with step 0.1. The curvature is basically determined by κ and further modulated by the inflow ratio η.—ISI in both displays are constant 0.5 s. Thin diagonal line indicates the chronometrically correct response r = s.

