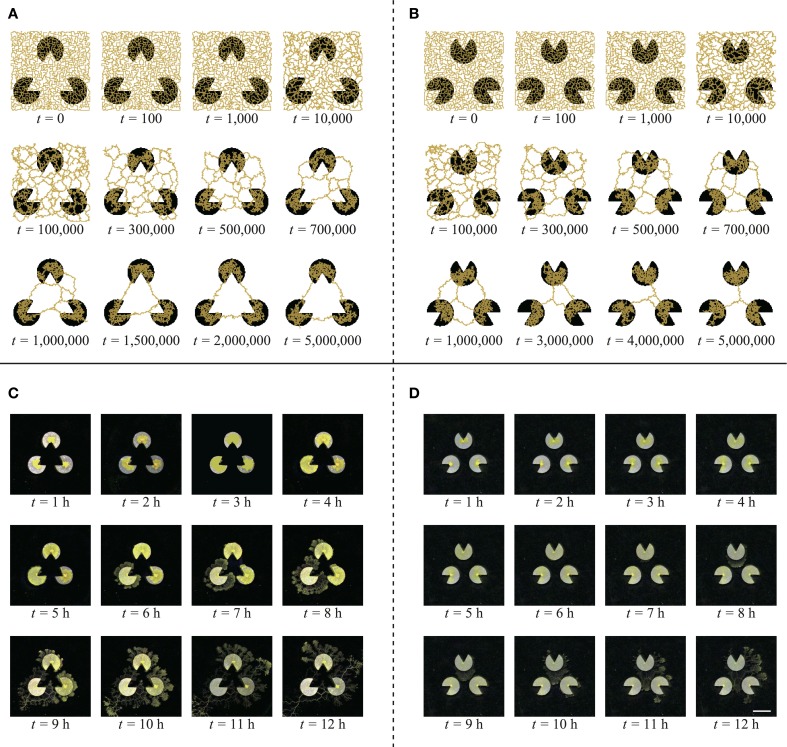
Figure 7.
Typical evolution of the networks of model (A,B) and real plasmodium (C,D) (scale bar: 10 mm). (A) For the Kanizsa diagram, the network structures are highly stable. (B) In the control diagram, the network changes gradually and becomes shorter. (C) The plasmodium does not enter the central area of the illusory triangle. (D) The plasmodia occupy the middle area of the pac-men.

