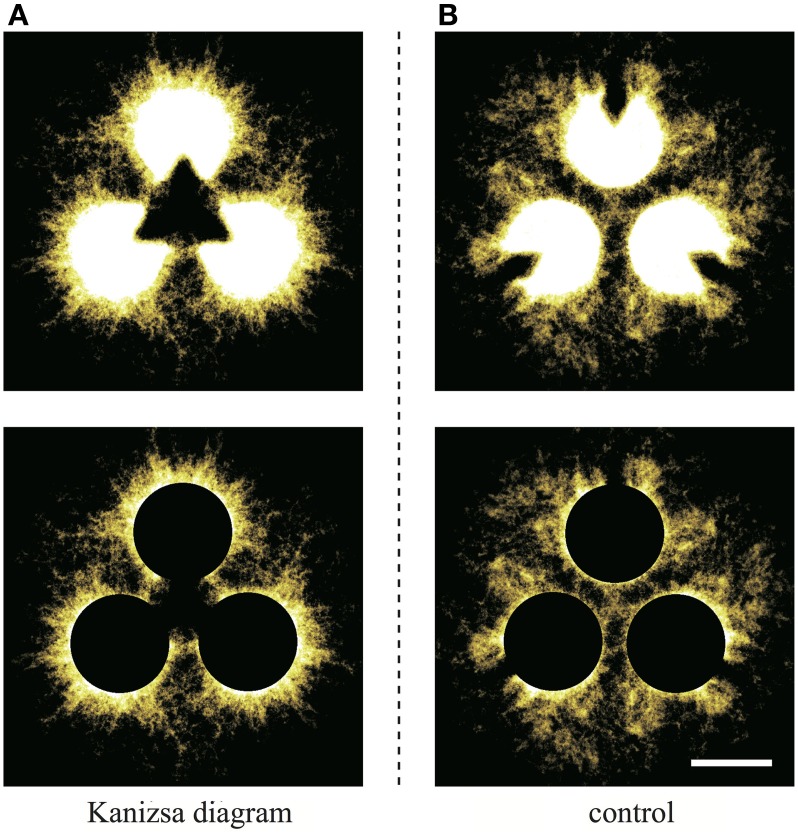
Figure 9.
The upper diagrams are produced by stacking binaralized images of the plasmodial networks for all trials. (A) Kanizsa diagram and (B) control. The brightness of each site indicates the intensity of lapping; that is the existence probability of the plasmodium at the site. A filter that cuts-off the weak signals was applied to improve visibility. This threshold is common to both figures. In the lower diagrams, to wipe out the effect of Kanizsa illusory contour, the pac-men are covered by black (scale bar: 10 mm).

