
FIGURE 1.
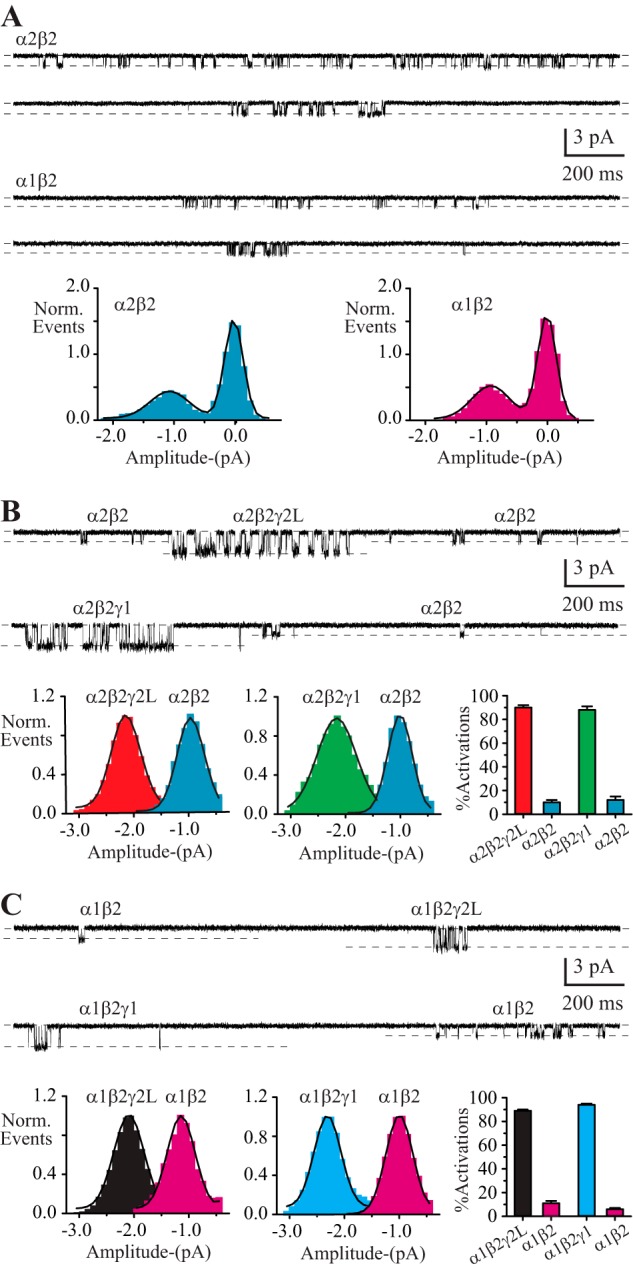
Distinguishing αβ and αβγ receptors. A, sample single channel recordings from patches expressing α2β2 (above) and α1β2 (below) receptors, along with the corresponding amplitude histograms. Transfecting only α and β subunits produced GABA-activated channel activity of ∼1 pA in amplitude. B and C, recordings from patches excised from cells transfected with α2, β2, γ2L or γ1 (B), or α1, β2, γ2L or γ1 (C), showing examples of αβγ (∼2 pA) and αβ (∼1 pA) channel activations in the same patches. The accompanying amplitude histograms show that αβ and αβγ channels are clearly distinguishable in terms of amplitude, and the bar graphs on the far right show the relative proportions of αβγ and αβ channel activations, averaged over 3–5 patches, for each αβγ channel transfection type.