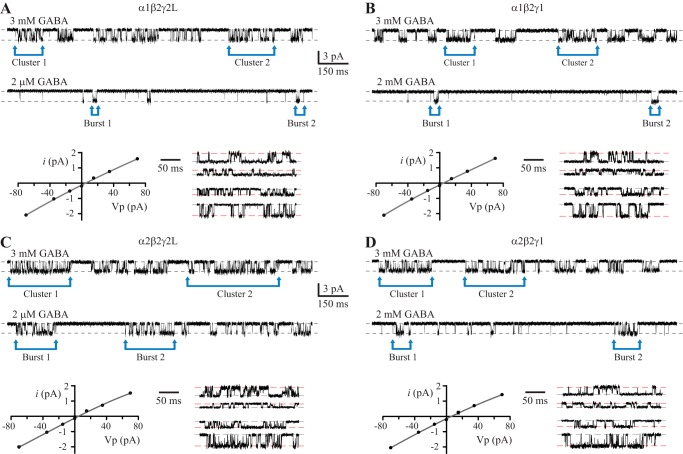
FIGURE 3.
Single channel activations and I-V. Single channel currents elicited by saturating (3 mm, above) and subsaturating (2 μm, below) concentrations of GABA for patches expressing (A) α1β2γ2L, (B) α1β2γ1, (C) α2β2γ2L, and (D) α2β2γ1 GABAARs. The tcrit values at 3 mm GABA, ranged between 25 and 35 ms, whereas those for activity elicited by 2 μm GABA ranged between 35 and 45 ms. Accompanying the activations are the I-V relationships of each receptor, generated from averaged data from 3 to 5 patches, along with sample currents at ±70 and ±35 mV (the open level is indicated by a red broken line). The main subunit-dependent differences are the duration of discrete active periods, especially at 2 μm GABA. Bursts of activity from α2-containing receptors remain active for 3–4-fold longer than bursts recorded from α1-containing receptors. The burst lengths for the four GABAARs follow the same pattern as the deactivation rates of macropatch currents.

