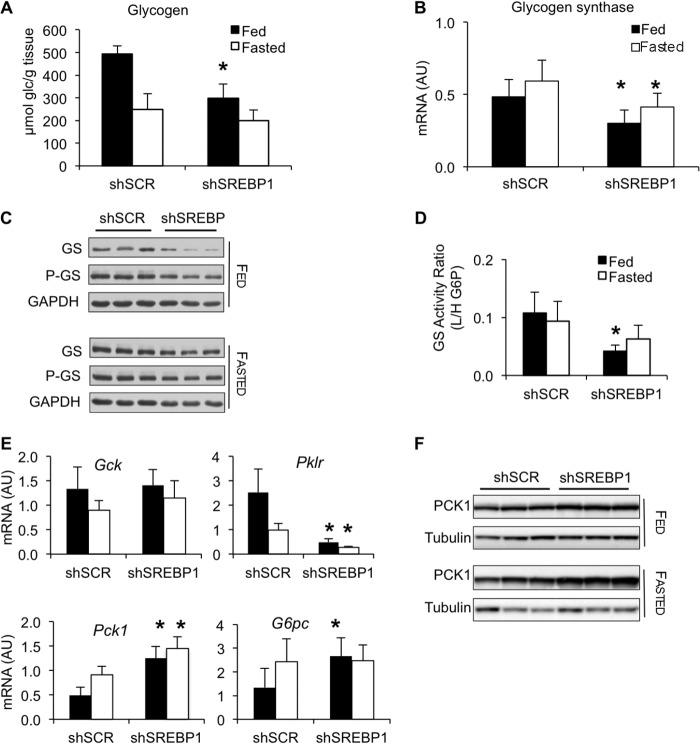
FIGURE 5.
SREBP-1 silencing alters gluconeogenesis and glycogen synthesis. db/db mice were treated as described in Fig. 2. A, hepatic glycogen content in db/db mice; n = 8. B, glycogen synthase 2 mRNA levels; n = 7–8. AU, arbitrary units. C, immunoblot analysis of total and phosphorylated glycogen synthase. D, ratio of the glycogen synthase activity measured with low (L) over high (H) glucose 6-phosphate, under fed and fasted conditions; n = 3; *, p < 0.05 versus control. E, Gck, Pklr, Pck1, G6pc mRNA expression; n = 7–8. F, PCK1 protein levels. Error bars, S.D.

