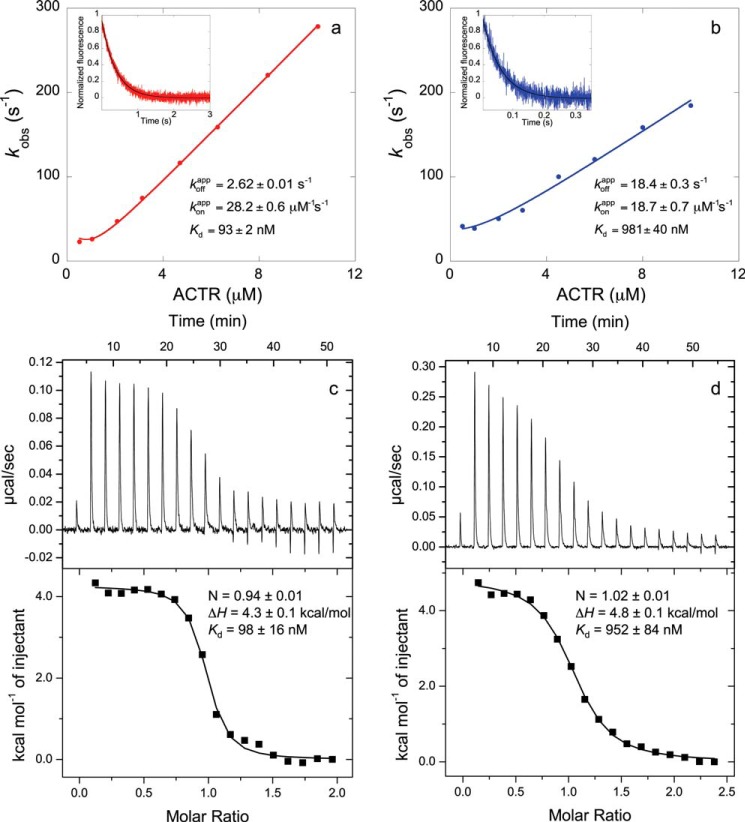
FIGURE 1.
Comparison of equilibrium dissociation binding constants (Kd) obtained by stopped-flow fluorometry (NCBDY2108W/ACTRWT (a) and NCBDY2108W/ACTRL1049A (b)) and isothermal titration calorimetry (NCBDY2108W/ACTRWT (c) and NCBDY2108W/ACTRL1049A (d)). Observed rate constants (kobs) are plotted against the concentration of ACTR, and from the fitting (12), the apparent association rate constant of binding (konapp) is obtained. The insets show a trace in a displacement experiment in which a preformed NCBDY2108W/ACTR solution was mixed with an excess of NCBDWT to obtain the apparent dissociation rate constant (koffapp). Stopped-flow data shown in a are from Dogan et al. (7), and data shown in b are from Dogan et al. (8). The two different methods produced the same Kd.

