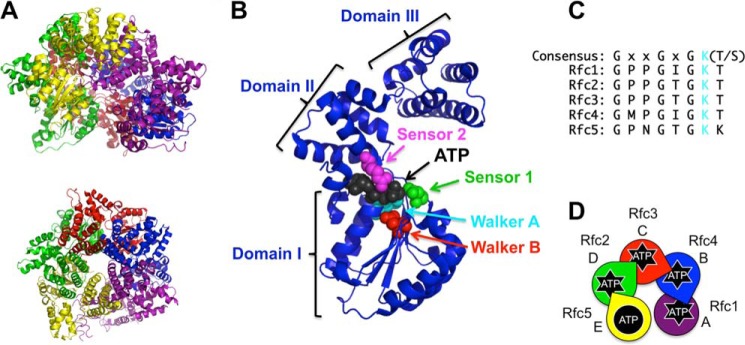
FIGURE 1.

RFC structure and ATP binding sites. A, schematic diagram of S. cerevisiae RFC (Protein Data Bank code 1SXJ) shown from a side (top) and top (bottom) view (7). α-Helices are shown as coils, and β-strands are shown as arrows. RFC subunits are colored as follows: Rfc1, purple; Rfc4, blue; Rfc3, red; Rfc2, green; and Rfc5, yellow. This color scheme is used throughout the figures. B, ribbon diagram of the Rfc4 subunit showing the three dominant structural domains and the amino acid residues within the ATP binding pocket that coordinate ATP binding and hydrolysis. The highlighted residues are: Walker A (cyan; Lys-55), Walker B (red; Asp-114), sensor 1 (green; Asn-145), and sensor 2 (magenta; Arg-203). C, alignment of the Walker A (P-loop) sequence for each of the RFC subunits. The conserved Lys residue (mutated to Ala to generate point mutants in this study) is shown in cyan. D, schematic representation of the RFC subunit arrangement using S. cerevisiae nomenclature for each subunit along with a species-independent A–E designation. The color scheme matches the structure in A. Subunits that can bind and hydrolyze ATP have “starbursts.” Arginine fingers are shown as wedgelike protrusions. This schematic is included in each figure with data color-coded in the same way (e.g. data for the Rfc1 mutant are shown in purple).
