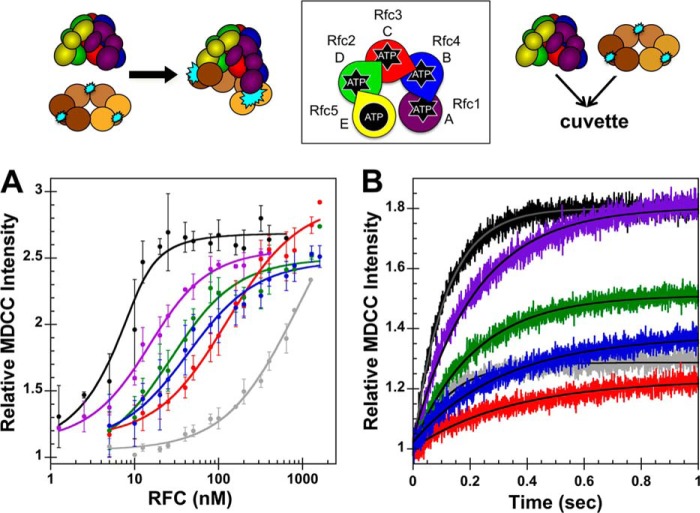
FIGURE 3.
Binding equilibria and observed rates for RFC complexes binding PCNA. A schematic representation of the RFC subunit arrangement and schematics of the assays are shown above the data. A, equilibrium clamp binding is shown for WT RFC (black), WT RFC without ATP (gray), Rfc1GAT (purple), Rfc2GAT (green), Rfc3GAT (red), and Rfc4 GAT (blue). PCNA-MDCC fluorescence was measured in solutions containing 10 nm PCNA-MDCC and 0–1600 nm clamp loader in assay buffer. The average relative MDCC intensities and standard deviations from three independent experiments are plotted and fit to Equation 1. Dissociation constants (Kd,app values) were calculated for each experiment, and the average values and standard deviations are given in Table 1. B, pre-steady-state clamp binding is shown for WT RFC (black), WT RFC without ATP (gray), Rfc1GAT (purple), Rfc2GAT (green), Rfc3GAT (red), and Rfc4GAT (blue). The increase in MDCC intensity was measured as a function of time when a solution of clamp loader and 0.5 mm ATP (when present) in assay buffer was rapidly mixed with a solution of PCNA-MDCC and 0.5 mm ATP (when present) in assay buffer. Reactions contained 20 nm PCNA-MDCC and 200 nm clamp loader. Solid lines are the result of an empirical fit of the data to a single exponential rise. Observed rates were calculated for three independent experiments, and the average values and standard deviations are given in Table 2. Final assay buffer for both experiments contained 30 mm HEPES, pH 7.5, 150 mm NaCl, 2 mm DTT, 10 mm MgCl2, 10% glycerol, 750 mm maltose, and 0.5 mm ATP (where present). Error bars represent S.D.

