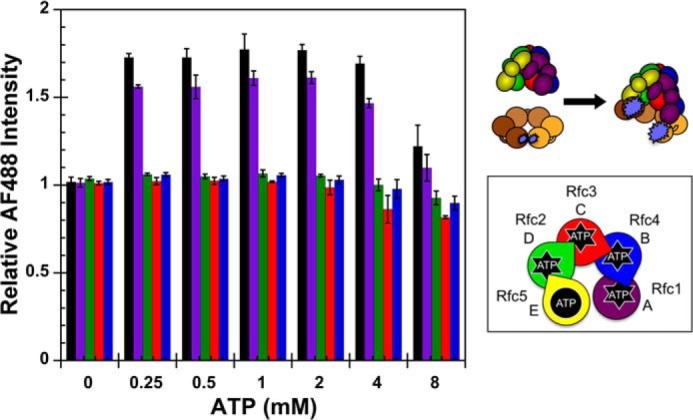
FIGURE 5.

Equilibrium ATP titration. A schematic representation of the RFC subunit arrangement and a schematic of the assay are shown to the right of the data. Equilibrium clamp opening as a function of ATP concentration is shown for WT RFC (black), Rfc1GAT (purple), Rfc2GAT (green), Rfc3GAT (red), and Rfc4GAT (blue). PCNA-AF4882 fluorescence was measured in solutions containing 10 nm PCNA-AF4882 and 200 nm clamp loader in assay buffer. The average relative AF488 intensities and standard deviations from three independent experiments are plotted against ATP concentration. Final assay buffer contained 30 mm HEPES, pH 7.5, 150 mm NaCl, 2 mm DTT, 10 mm MgCl2, 10% glycerol, and 750 mm maltose. Error bars represent S.D.
