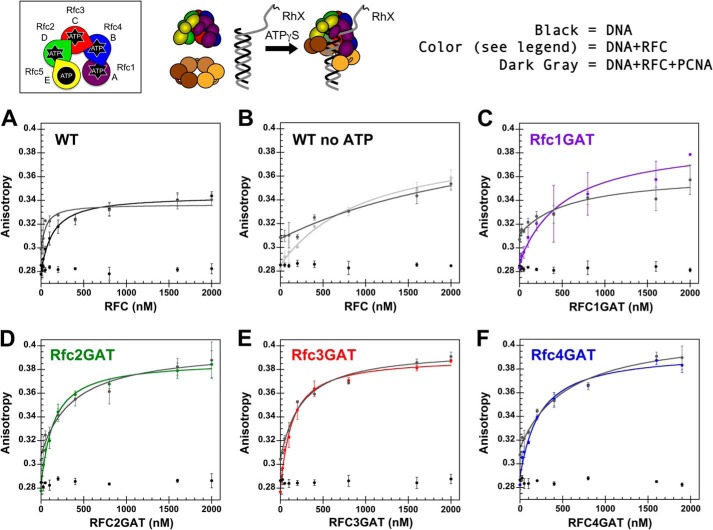
FIGURE 7.
Anisotropy-based DNA binding. A schematic representation of the RFC subunit arrangement and a schematic of the assay are shown above the data. Equilibrium DNA binding is shown for WT RFC (black) (A), WT RFC without ATPγS (light gray) (B), Rfc1GAT (purple) (C), Rfc2GAT (green) (D), Rfc3GAT (red) (E), and Rfc4 GAT (blue) (F). In each panel, the data for free DNA is shown in black, and the data for clamp loader binding in the presence of PCNA is shown in dark gray. DNA-RhX anisotropy was measured in solutions containing 25 nm DNA-RhX, 2 μm WT PCNA, 0.5 mm ATPγS, and 0–2 μm clamp loader in assay buffer. The average anisotropy and standard deviations from three independent experiments are plotted and fit to Equation 2 for clamp loader-DNA binding and clamp loader-DNA-PCNA binding. Dissociation constants (Kd values) were calculated for each experiment, and the average values and standard deviations are given in Table 3. Final assay buffer contained 30 mm HEPES, pH 7.5, 150 mm NaCl, 2 mm DTT, 10 mm MgCl2, 10% glycerol, and 750 mm maltose. Error bars represent S.D.

