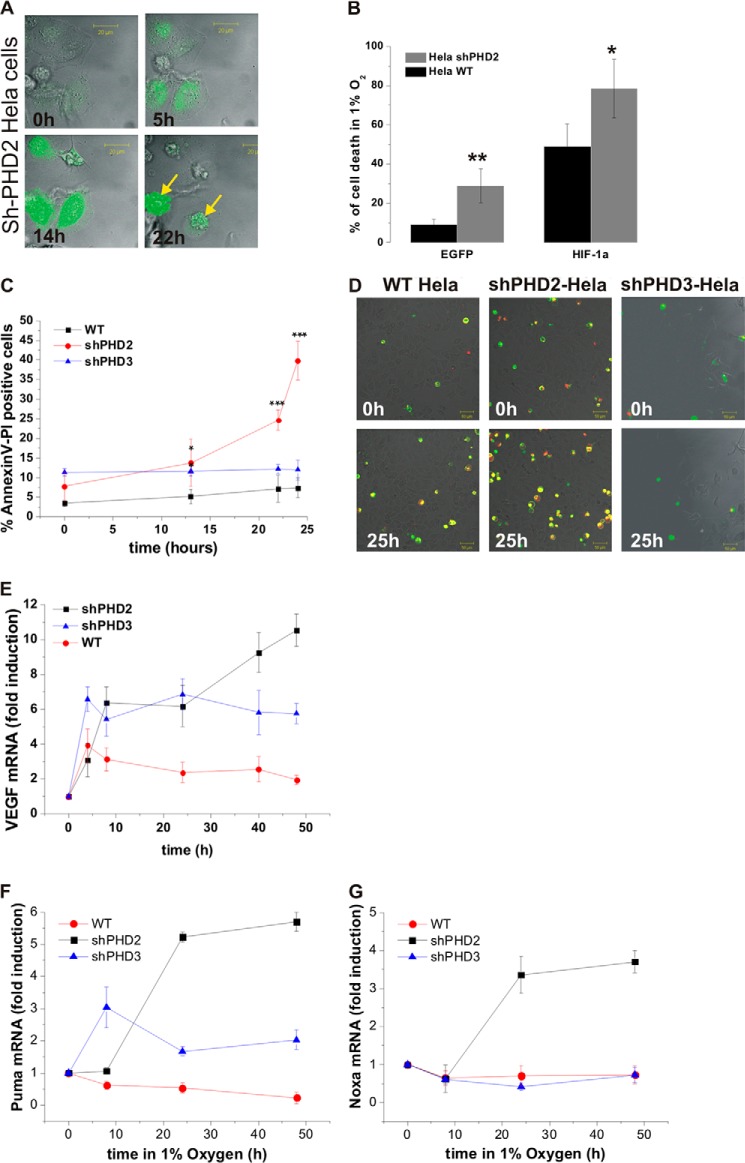
FIGURE 7.
A, pictures of a representative field of sh-PHD2 cells expressing HIF-1α-EGFP at the indicated times in hypoxia show cell death associated with high and long lasting levels of HIF-1α. B, the percentage of transfected sh-PHD2 or WT HeLa cells dying within the 20 h of an imaging experiment was calculated for control cells transfected with either an empty EGFP plasmid or with HIF-1α-EGFP in normoxia and hypoxia (n = 40 cells/conditions). C and D, HeLa cells (WT, shPHD2 or shPHD3 lines) were imaged simultaneously using a 4-compartment glass bottom dish (Greiner). They were labeled with Annexin V-FITC (green) and PI (red) 10 min before imaging. Cells were imaged for 2 h in normoxia prior to the switch to 1% O2. Images were recorded every 15 min for 24 h. The number of apoptotic cells (Annexin labeling preceding the PI labeling) was counted out of the total number of cells and plotted (C). A typical field of cells at several time points is shown (D). E–G, WT, HeLa cells, or HeLa cells expressing shPHD2 or shPHD3, were cultured in 1% O2 for the indicated time points. E, VEGF mRNA levels were assessed by qPCR. F, PUMA mRNA levels were assessed by qPCR. G, Noxa mRNA were assessed by qPCR. E–G, the plots represent the average ± S.D. of triplicate samples from a representative experiment. The experiments were performed 4 times. Results are the mean of three independent experiments ± S.E. ***, **, and * indicate statistical difference with p < 0,001, p < 0.01, and p < 0.05, respectively.

