
FIGURE 5.
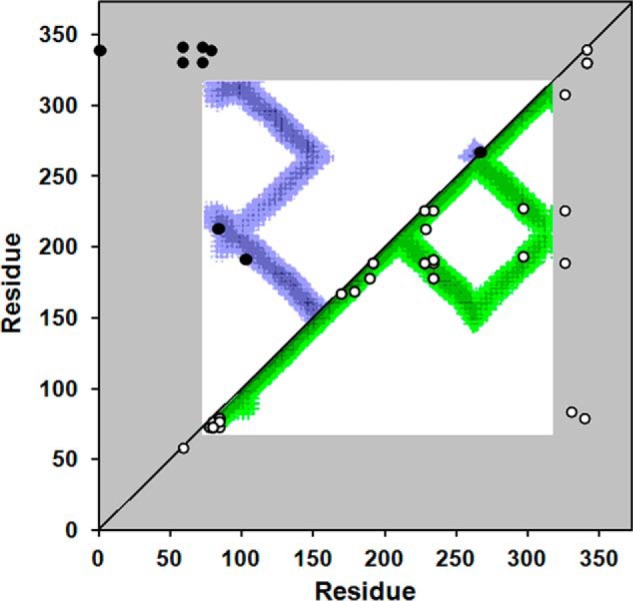
Cross-linking data from Tables 1 and 2 superimposed on a molecular contact plot generated from the crystal structure of dimeric apoA-IV64–335. The x and y axes of the plot indicate the residue number of apoA-IV from 1–376. The diagonal line bisects the figure; the top left is used to evaluate intermolecular interactions, whereas the bottom right shows intramolecular interactions. Using the crystal structure of human apoA-IV64–335 (22), we produced a contact map for each amino acid. The regions of the darkest shade of purple represent proximity of 1–10 Å, lighter gradations represent 11–15, 16–20, and 21–24 Å, respectively. White indicates greater than 24 Å. For example, residue 100 of one molecule (x axis) is within 11–15 Å of residue 200 (y axis) of the other molecule in the dimeric crystal structure as indicated by the purple color at their intersection on the graph. On the other hand, residue 100 is quite far away from residue 250 of the other molecule (white where they intersect). Because the crystal structure only provides structural data between residue 74 and 314 (in white), areas where the contact plot could not be generated are shown in gray. The cross-links between Lys residues shown in Tables 1 and 2 are superimposed on the figure (intermolecular links in black in the upper left, intramolecular links in white on the lower right). In cases where Lys assignments in cross-links were ambiguous, the Lys residues with the shortest separation distance were plotted.